Server statistics
DCImanager 6 collects statistics on traffic and power consumption for servers. Power consumption statistics are collected from the PDU ports to which the server is connected. Data for statistics are collected every five minutes from the devices ports to which the server is connected. Traffic statistics are calculated in one of the following methods:
by the volume of traffic from the switch ports to which the server is connected;

You can disable statistics collection from certain switch ports. Read more in Configuring a switch.
- using data from the Netflow protocol. You can enable this method in the location settings. Read more in Location management.
Data are collected by the following parameters:
- traffic volume — total amount of transmitted information. Both incoming and outgoing traffic is taken into account;
- channel load — volume of data transmitted over the communication channel per unit of time. Both incoming and outgoing traffic is taken into account;
- channel load (Burstable) — the actual bandwidth consumption based on the burstable methodology: 5% of the maximum measurements collected with an interval of 5 minutes for the selected period are not taken into account. Both incoming and outgoing traffic is taken into account;
- power consumption, kWt*h (only for servers connected to C3 Solutions or RPCM PDU).
The interval for collecting statistics is five minutes
The storage period of statistics data:
- collected from equipment ports — one year;
- collected via NetFlow protocol — three years.
DCImanager 6 administrator has access to statistics on all servers, while the user — only on the servers owned.
To view the server statistics, go to the server page: Servers → select the server → Server parameters → Statistics. You can view statistics over the day, week, month, year or choose an arbitrary period. You can also view statistics for a specific server connection to the switch or PDU. If the statistics are collected via NetFlow, you can select the desired server interfaces.
To view the parameter value at a specific time moment, move the cursor over the graph. To scale the graph on the time axis, select the required time interval on the graph or select it with the buttons above the graph.
The total parameter value over the selected period is displayed under the graph.
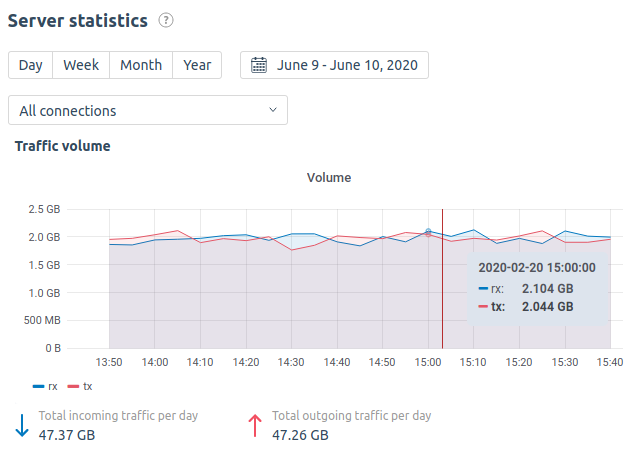
Statistics section interface
Useful tips
Related topics:Knowledge base articles: