NetFlow statistics collection
You can configure the collection of network traffic statistics in a location using the NetFlow protocol and the industry standard sFlow. The statistics are stored in the Clickhouse database (DB) and are available for display in the platform interface and Grafana monitoring system.
In the statistics collection settings you can specify subnets, traffic from which should not be counted by the billing platform. In the current implementation of the platform this function is implemented via API request.
Enabling statistics collection
Via platform interface
- Click on the DCImanager 6 logo in the upper left corner of the screen.
- Select the desired location.
- In the Location settings block, click the All settings button.
- On the location settings tab:
- Enable the Allow NetFlow statistics collection at the location option.
Select location IP for NetFlow — a list of location IP addresses to which the network equipment sends NetFlow/sFlow statistics.
- Specify the ports to collect statistics:
- NetFlow v5 port.
- NetFlow v9/v10 (IPFIX) port.
- sFlow port.
- To display NetFlow statistics in the server card, enable the Use default NetFlow statistics data option. If the option is disabled, the server card will display statistics on network connections, and NetFlow statistics will be available in the Grafana monitoring system.
- Click the Apply button.
Via Swagger interface
- In the right-hand menu, click the
 icon → Swagger.
 - Go to the DCI back section.
Run POST request location/{location_id}/setup. In the request body specify:
Example request body
{"netflow":{"addresses":["192.0.2.100"],"collect_netflow":true,"port":2055,"port_v5":2056,"port_sflow":6343},{"settings":{"statistic_type":"netflow"},"ip_filter": ["192.0.2.0/24", "198.51.100.0/28", "203.0.113.1/32"]}CODECommentsaddresses — a list of IP addresses of the location to which the network equipment sends NetFlow/sFlow statistics
port — port for collecting NetFlow v9/v10 (IPFIX) statistics
port_v5 — port for collecting NetFlow v5 statistics
port_sflow — port for collecting sFlow statistics
statistic_type — type of statistics to display in the server card. Possible values:
- netflow — NetFlow statistics;
- switch — statistics on network connections
ip_filter — list of subnets, traffic from which should not be counted by the billing platform
Via terminal
- Get an authorization token:
curl -k -X POST -H "accept: application/json" -H "Content-Type: application/json" 'https://domain.com/auth/v4/public/token' -d '{"email": "admin_email", "password": "admin_pass"}'CODEComments to the commanddomain.com — domain name or IP address of the server with the platform
admin_email — platform administrator's email
admin_pass — platform administrator's password
In response, you will get the message in the form:
Example of response in JSON
{ "confirmed": true, "expires_at": null, "id": "6", "token": "4-e9726dd9-61d9-2940-add3-914851d2cb8a" }CODESave the received token value.
Run the request:
Example request
curl -X POST 'https://domain.com/dci/v3/location/<location_id>/setup' -H 'x-xsrf-token: <token>' -H 'Cookie: ses6=<token>' -H 'isp-box-instance: true' -d '{"netflow":{"addresses":["192.0.2.100"],"collect_netflow":true,"port":2055,"port_v5":2056,"port_sflow":6343},{"settings":{"statistic_type":"netflow"},"ip_filter": ["192.0.2.0/24", "198.51.100.0/28", "203.0.113.1/32"]}'BASHComments to the commanddomain.com — domain name or IP address of the server with the platform
<location_id> — location ID
<token> — authorization token
addresses — a list of IP addresses of the location to which the network equipment sends NetFlow/sFlow statistics
port — port for collecting NetFlow v9/v10 (IPFIX) statistics
port_v5 — port for collecting NetFlow v5 statistics
port_sflow — port for collecting sFlow statistics
statistic_type — type of statistics to display in the server card. Possible values:
- netflow — NetFlow statistics;
- switch — statistics on network connections
ip_filter — list of subnets, traffic from which should not be counted by the billing platform
When the request is executed, the platform will launch additional docker containers on the location:
- etc_goflow_1 — data collection container;
- flow_msg_queue — temporary storage of the message queue.
The etc_goflow_1 container collects statistics from the equipment and sends them to the flow_msg_queue container. The brokerctl service in the dci_consumer_1 container takes data from the flow_msg_queue container and saves it to the Clickhouse database. The data is stored in the flows table.
Viewing statistics
In the platform interface
The statistics view is available if the Use default NetFlow statistics data option is enabled in the location settings.
To view the server statistics, go to the server page: Servers → select the server → Server parameters → Statistics. You can select the interface and period for which you need to show statistics.
In Grafana
To go to the Grafana interface, in the right-hand menu, click the ![]() icon → Grafana.
icon → Grafana.
The statistics are available in dashboards:
- Netflow — full statistics for platform administrators. Includes traffic from subnets specified via the ip_filter parameter;
- Traffic-netflow-dashboard — statistics on individual servers for users. Does not include traffic from subnets specified via the ip_filter parameter. Each user can see statistics for his own servers only.
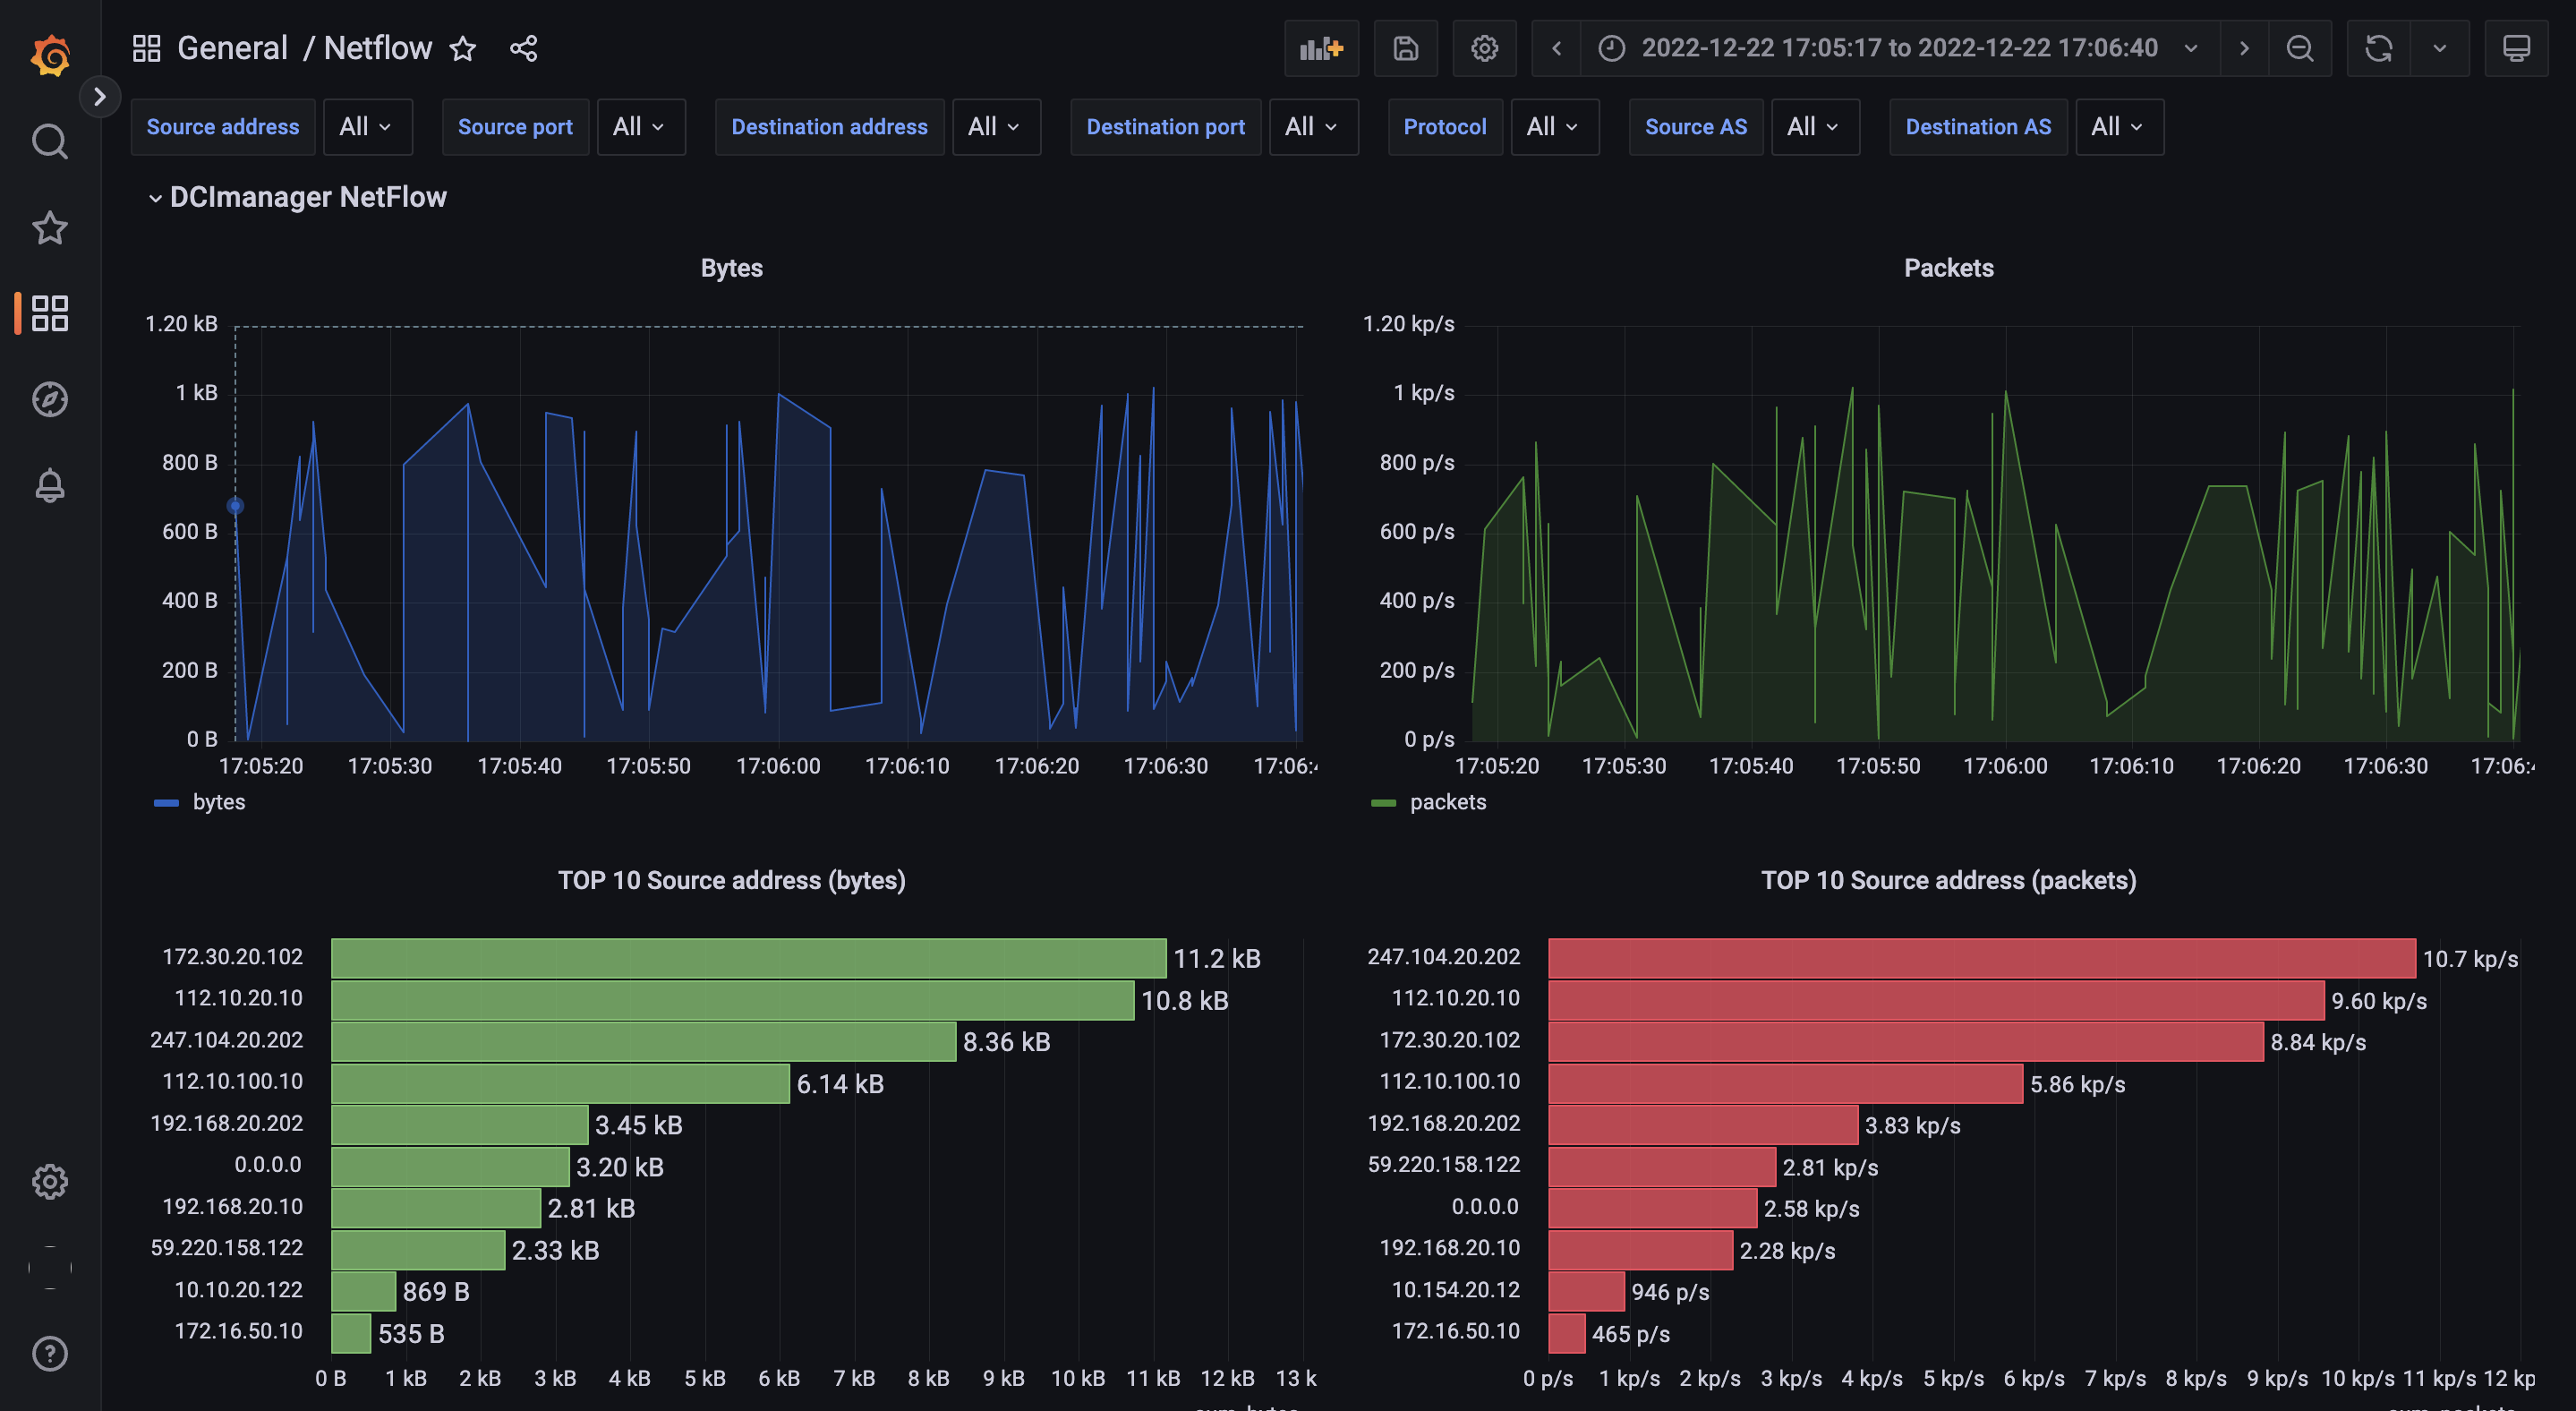
Netflow dashboard interface
Platform administrators can export statistical data in CSV format. To do this:
- Go to the NetFlow dashboard → context menu of the Complete data panel → Inspect → Data.
- On Data tab, click Download CSV button.
Diagnostics
etc_goflow_1
Connect to the location via SSH and run the command:
docker logs -f etc_goflow_1flow_msg_queue
Connect to the location via SSH and run the command:
docker logs -f flow_msg_queuebrokerctl
Connect to the platform server via SSH and run the command:
docker exec -it dci_consumer_1 less -R /var/log/brokerctl.log