Traffic
DCImanager enables you to monitor traffic consumption by servers. Statistics is collected from a switch if it is connected to the system. Learn more under Add switch.
To view the traffic statistics, navigate to Statistics → Network.
Statistics collection methods
DCImanager collects the traffic statistics from:
- Switch ports;
- NetFlow/IPFIX — statistics from IP addresses. You need to install and configure the "NetFlow" module. For more information please refer to the article "NetFlow".
Report
- Period — select a period to display the statistics:
previous day;
current day;
current week;
current month;
current year;
previous week;
previous month;
previous year;
week;
month;
quarter;
half-a-year;
year;
any period;
whole period.
- Start date — enter the start date of the period. This field is displayed only if the "any period" is selected;
- End date — enter the end date of the period. This field is displayed only if the "any period" is selected;
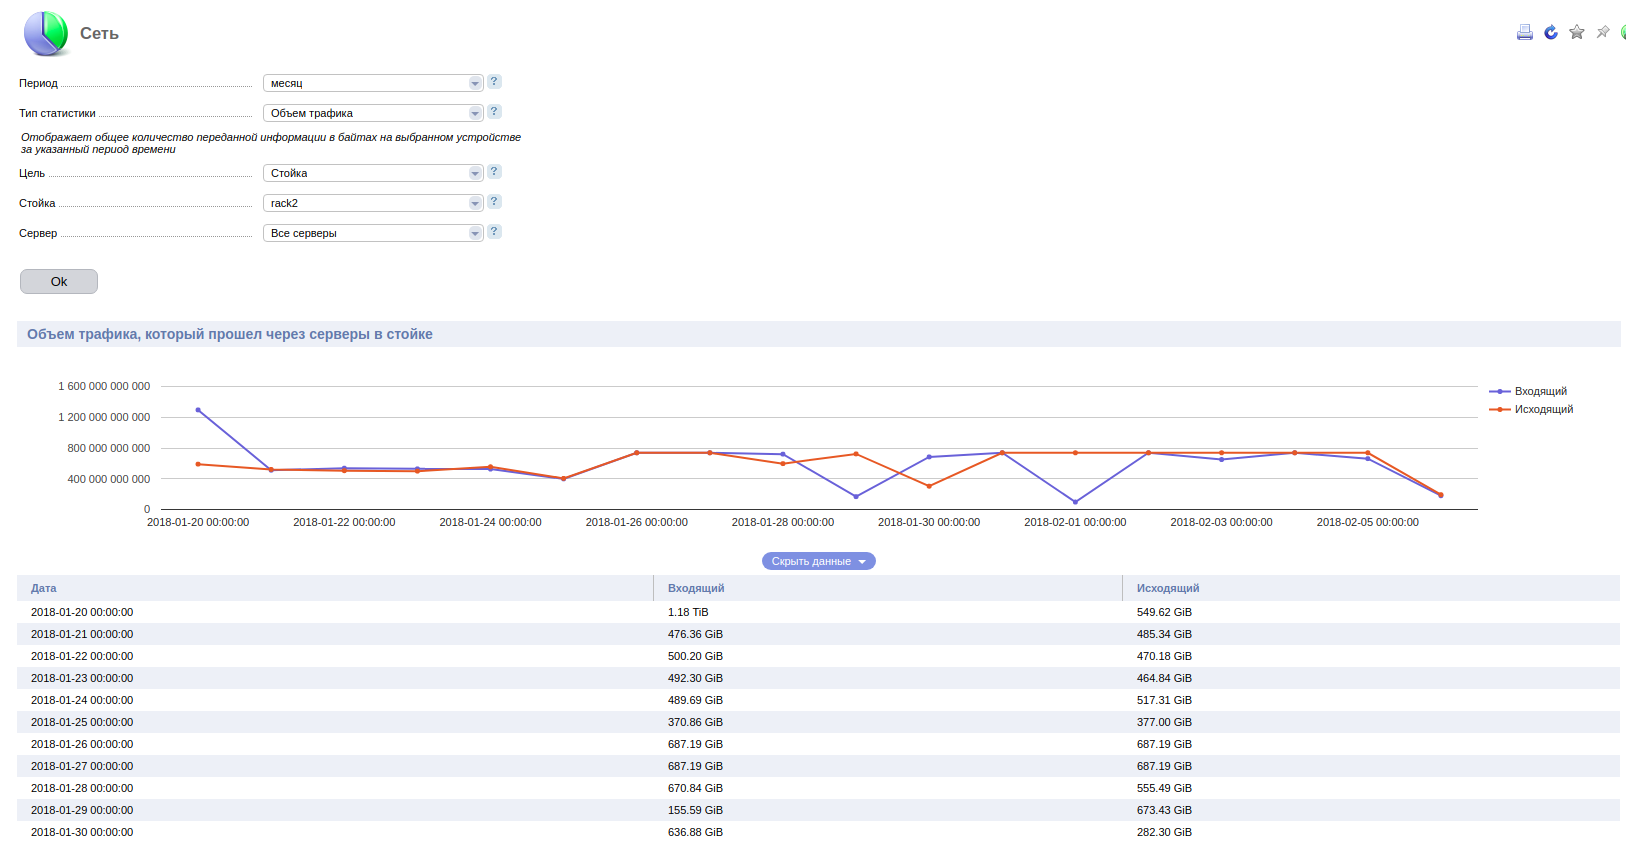
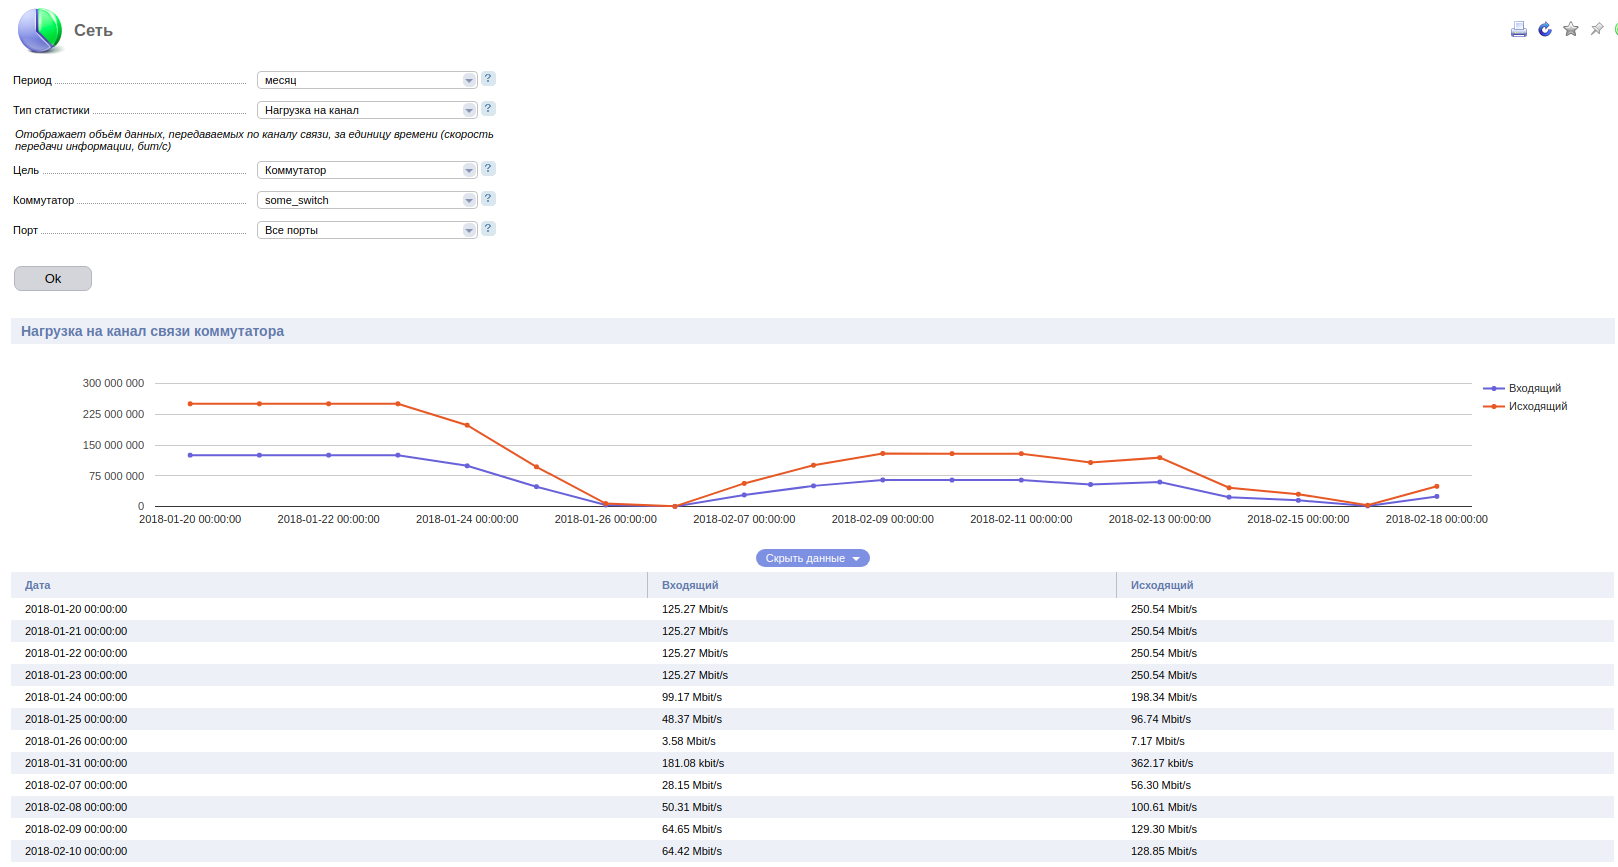
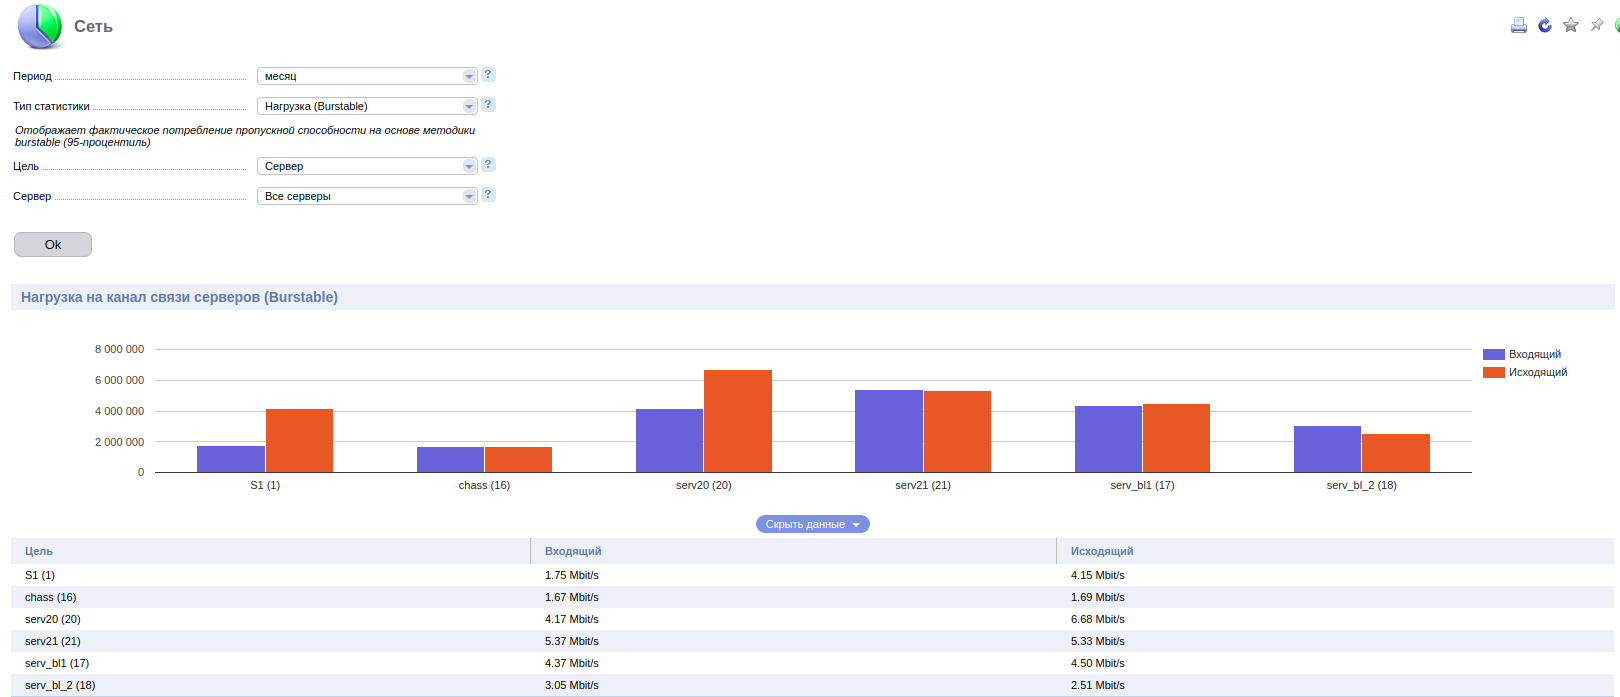
- Statistics type:
- Traffic;
- Channel load;
- Burstable.
- Equipment — select a type of equipment to show the statistics;
- Rack — select a rack to show the statistics. The system displays the average value for all servers in the selected rack. The field is available only if you select "Rack" in Equipment;
- Server — select a server to show the statistics. The field is available only if you select "Server" in Equipment;
- Switch — select a switch to show the statistics. The field is available only if you select "Switch " in Equipment;
- Port — select a port to show the statistics. The field is available only if you select "Port" in Equipment;
Note
If there are several UpLinks for one server, monitor the server traffic usage per each UpLink on the corresponding switch ports. Server statistics is displayed for all UpLinks.Note
DCImanager does not collect statistics for ports of VLAN that have an owner.
Types of statistics
DCImanager collects the following information:
- Traffic usage — the total amount of transmitted information. It shows the incoming and outgoing traffic;
- Channel load — the amount of data transmitted through the channel over a certain period. It shows the incoming and outgoing traffic;
- Burstable — channel load collected every 5 minutes. Top 5% are ignored.
Traffic usage
Channel load
Burstable
How it works
Collecting statistics from switch ports
The information from the switch is kept in the /usr/local/mgr5/var/stat/raw directory. By default, the system starts the cron job collectstat every 5 minutes.
Collecting statistics through NetFlow/IPFIX
When you enable NetFlow/IPFIX, DCImanager configures the NetFlow collector (nfacctd) on the server. The nfacctd configuration file is /usr/local/mgr5/etc/nfacctd.conf. We do not recommend that you modify the settings of nfacctd configuration file, as the control panel rewrites them regularly.
The information collected from switches is saved in the /usr/local/mgr5/var/flow/ directory. If the Path to copy files is specified in the NetFlow module, the processed statistics files will be saved in that directory. A period to save statistics is specified in the nfacctd configuration file. The default value is 5 minutes. Every minute, DCImanager checks the /usr/local/mgr5/var/flow/ directory for new files, processes and locates them into /usr/local/mgr5/var/stat/raw/. The information from /usr/local/mgr5/var/flow/ is deleted. Preliminary processing enables to separate statistics data by servers. The cron command to run the handler:
/usr/local/mgr5/sbin/mgrctl -m dcimgr periodicNote
Burstable statistics may be inaccurate, as the NetFlow collector adds long-time connections into the file only when they are completed.
Processing statistics
Once an hour DCImanager processes the statistics in /usr/local/mgr5/var/stat/raw/ and saves it into the database directory /usr/local/mgr5/var/stat/mon/. To do so, the panel runs the cron commad:
/usr/local/mgr5/sbin/mgrctl -m dcimgr collectstat.hourlyThe control panel deletes the files that have been already processed from /usr/local/mgr5/var/stat/raw/. The data in /usr/local/mgr5/var/stat/mon/ are processed as Burstable.
By default, the information is processed in 4 threads at most. The maximum number of threads is specified with the options max_parallel_netflow_threads in the DCImanager configuration file /usr/local/mgr5/etc/dcimgr.conf.
Hourly and daily data are generated as long as statistics is collected. Hourly data are used to display statistics for the period less than a week, daily data — for the period more than a week.