NetFlow is a network protocol for collecting IP traffic information and monitoring network traffic. Based on the NetFlow Version 9 implementation, IPFIX allows keeping track of IP traffic.
With this module, you can collect /IPFIX statistics, display and export it from DCImanager. For more information about traffic statistics please refer to this
Installing and configuring the module
Navigate to Integration → Modules → Install to install the module.
Navigate to Integration → Modules → Settings to configure the module.
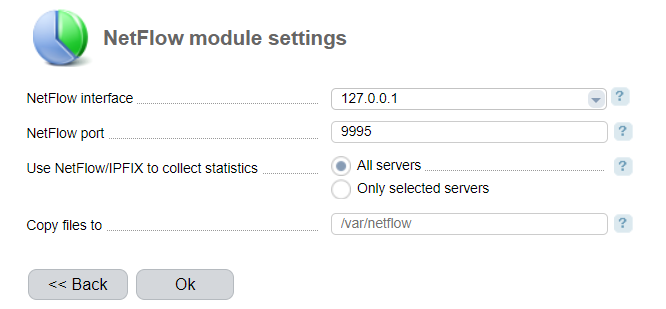
- NetFlow interface - network interface where the daemon will run.
- NetFlow port - port where the daemon will run
- Use NetFlow/IPFIX to collect statistics:
- All servers - the information will be collected from all the servers. The system doesn't calculate traffic usage information collected from switches;
- Only selected servers - NetFlow traffic usage information will be collected only from the selected servers. You need to choose a statistics collection method in Main menu → Servers→ Edit → Statistics collection;
- Copy files to — enter the directory where the NetFlow files will be kept. The data from this directory are not deleted automatically. After you add the directory, the NetFlow report section will be added into Tools;
- Inform when the report is ready — the option is available only if you enter the directory in the "Copy files to" field.
Management options
In Tools→ Modules→ Settings you can enter a path to the directory in the "Copy files to" field, and generate a report in Tools → NetFlow report:
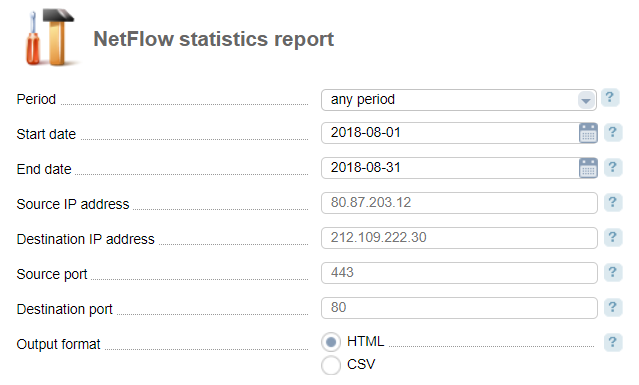
- Period — select a period to display the statistics:
previous day;
current day;
current week;
current month;
current year;
previous week;
previous month;
previous year;
week;
month;
quarter;
half-a-year;
year;
any period;
- whole period.
- Source IP address — leaving the field blank will show statistics for all source IP addresses;
- Target IP address — leaving the field blank will show statistics for all target IP addresses;
- Source port;
- Destination port;
- Output format: