. The control panel receives information every hour from the IPMI server, if it is connected, and from the measuring devices every five minutes if they are connected. Read more in the IPMI article. Read more about measuring devices in the article Creating a measuring device. To view the statistics navigate to Statistics → Temperature.
Creating the temperature report
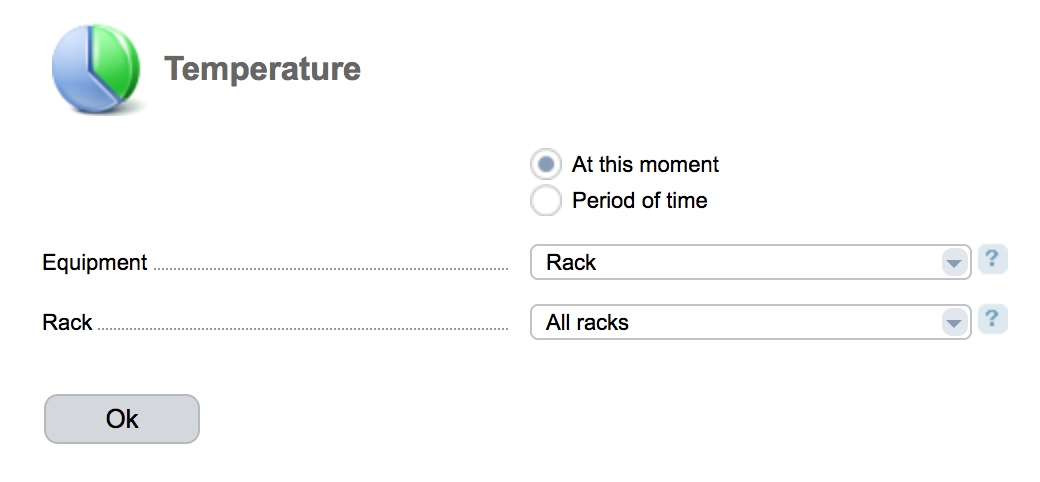
Specify:
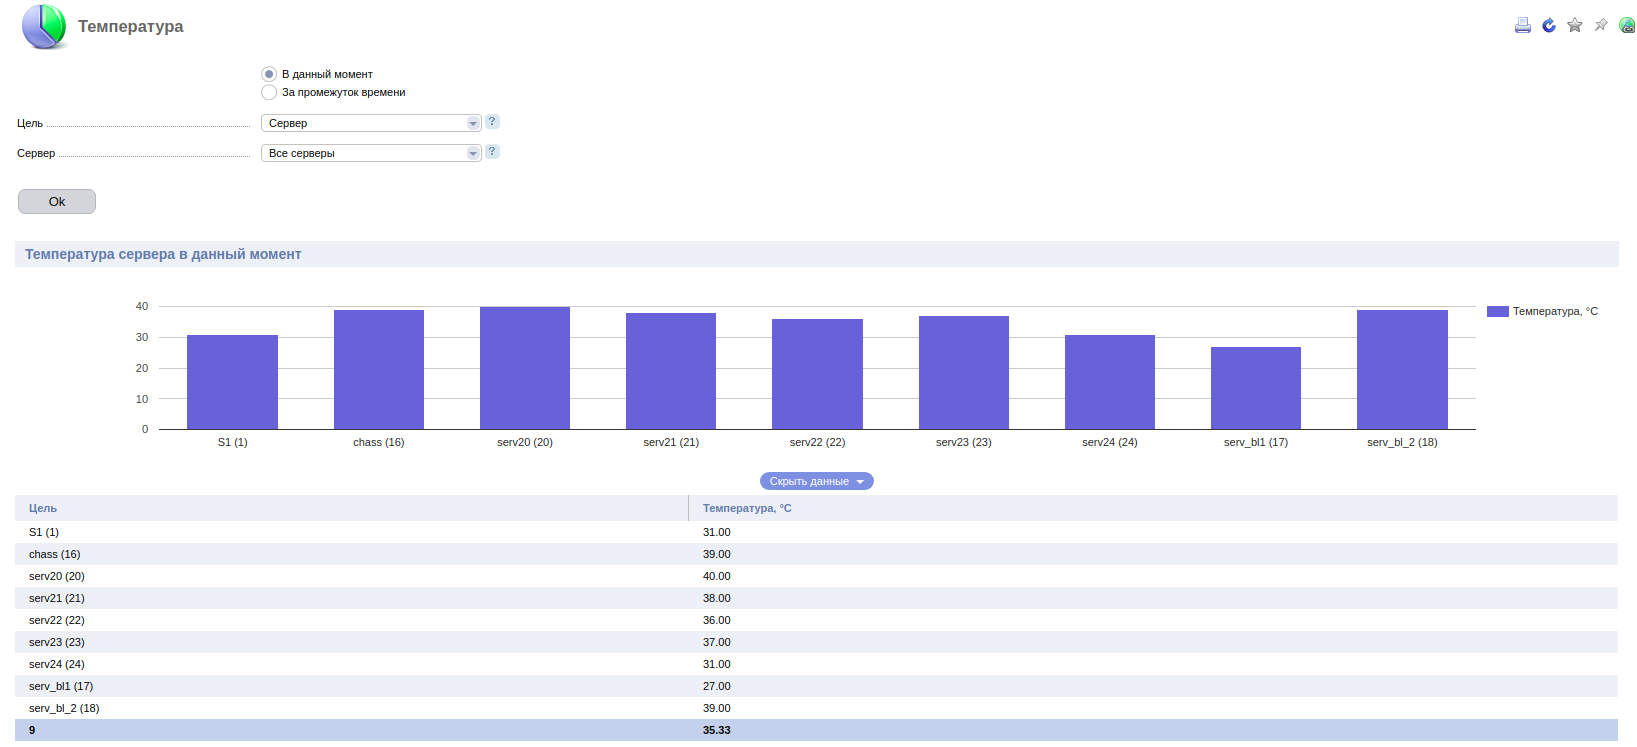
- At this moment — statistic display option, when the value was read during the last survey of an IPMI or measuring device;
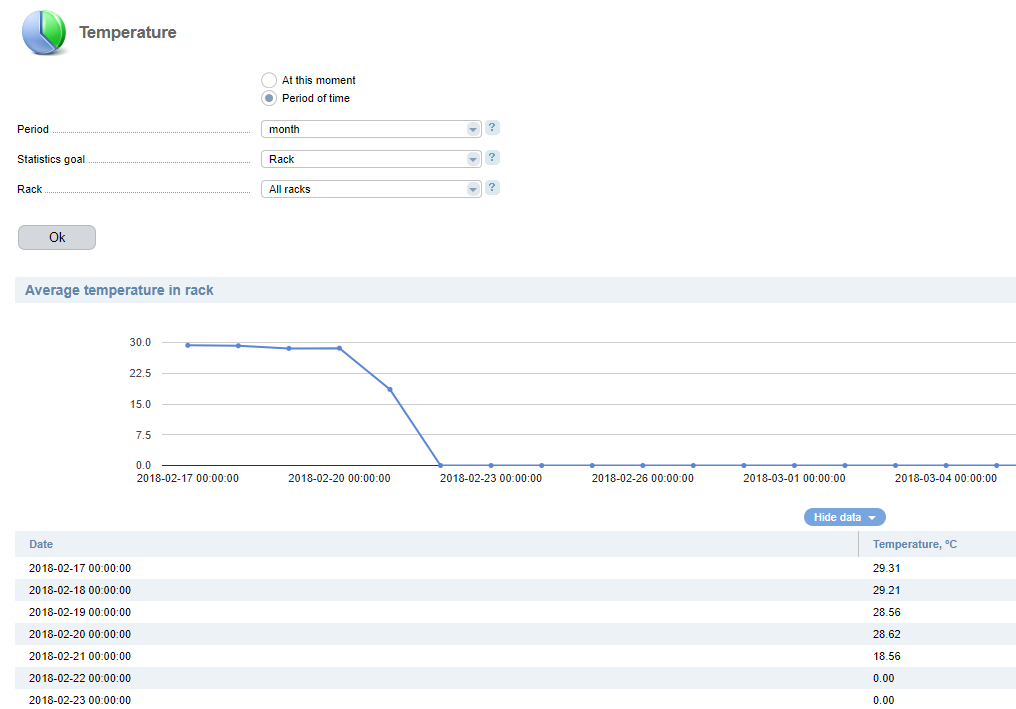
- Period of time — statistic display option during the specific period;
- Period — choosing the specific time period of statistics:
- previous day;
- current day;
- current week;
- current month;
- current year;
- previous week;
- previous month;
- previous year;
- week;
- month;
- quarter;
- half a year
- year;
- any period;
- whole period.
- Start day — the beginning of the period. The field is only available if "any period" was chosen in field Period.
- End date — the end of the period. The field is only available if "any period" was chosen in field Period;
- Equipment — a type of statistics target equipment;
- Rack — choosing the statistics target rack. The average value for all the servers in the chosen rack. The field is only available if "rack" was chosen in Equipment selector;
- Server — choosing the statistics target server. The field is only available if "server" was chosen in Equipment selector.
Temperature statistic report at the moment
Temperature statistic report during the specific period