Server monitoring using the OS agent module
The "Server Monitoring using the OS Agent" module allows you to retrieve the OS metrics of the server. Metrics contain information about the operation of the following:
- CPU;
- RAM;
- discs;
- network;
- system processes.
A full list of metrics to be collected is available at the link.
Metrics collection is supported for servers with OS based on Red Hat version 7.6 or higher.
How the module works
Monitoring is performed only for servers that are selected in the module settings. The Prometheus Node Exporter software is installed to collect metrics.
The collected metrics are stored on the server with the platform. The VictoriaMetrics software is used to store metrics.
The vmagent service installed on locations collects and transfers metrics to the storage. TLS keys are used for authorization on the server. The collected data is transferred to the storage via an SSH tunnel.
The vmagent service collects data through port 9100/TCP on the server's main IPv4 interface. If you change the primary IPv4 address, the service will automatically continue to collect metrics from the new address. If all IPv4 addresses are deleted, collection of metrics on the server will stop. To resume metrics collection on such a server, you need to allocate an IPv4 address for the server and reselect it in the module settings.
The monitoring data is available for viewing in Grafana on the Server monitoring dashboard.
Installing and configuring the module
To install the module, from the right menu, click the ![]() icon → Modules → Server monitoring using the OS agent → click Install.
icon → Modules → Server monitoring using the OS agent → click Install.
To configure the module:
- Select the locations where the module will be available: click Configure locations → select locations → click Apply.
- Select the servers from which the module will collect information: click Select servers → select servers → click Apply.
Install the monitoring client on all selected servers according to the instructions in the "Preparing servers" section.

Unique TLS keys are generated each time the module is installed. If the module has been reinstalled, reinstall the monitoring clients on the servers.
Preparing servers
To collect metrics from servers, install a monitoring client on those servers:
- In the right menu, click the
 icon → Modules → Server monitoring using the OS agent → click Select servers → click Download the monitoring client. An archive with the client will be downloaded to your workstation. The archive contains:
- Prometheus Node Exporter executable and configuration files;
- TLS key and certificates;
- installation script.
Copy the archive with the client to the server. For example, using the scp utility:
Example command
scp ~/Downloads/node_exporter.tar.gz root@192.0.2.1:/root/BASHFor more information about copying files via scp, see the article Workstation setup.
- Connect to the server via SSH.
- If the tar utility is not installed on the server, install it.
Unzip the archive with the client:
tar -xvf node_exporter.tar.gzBASHRun the installation script:
bash setup.run --installBASHCheck whether the monitoring service has started:
systemctl status prometheus-node-exporterBASH
To delete the monitoring service, run the command on the server:
bash setup.run --removeWorking with the module
For servers that have metrics collection enabled, a Monitoring section appears in the card. The section is displayed only in the platform administrator interface.
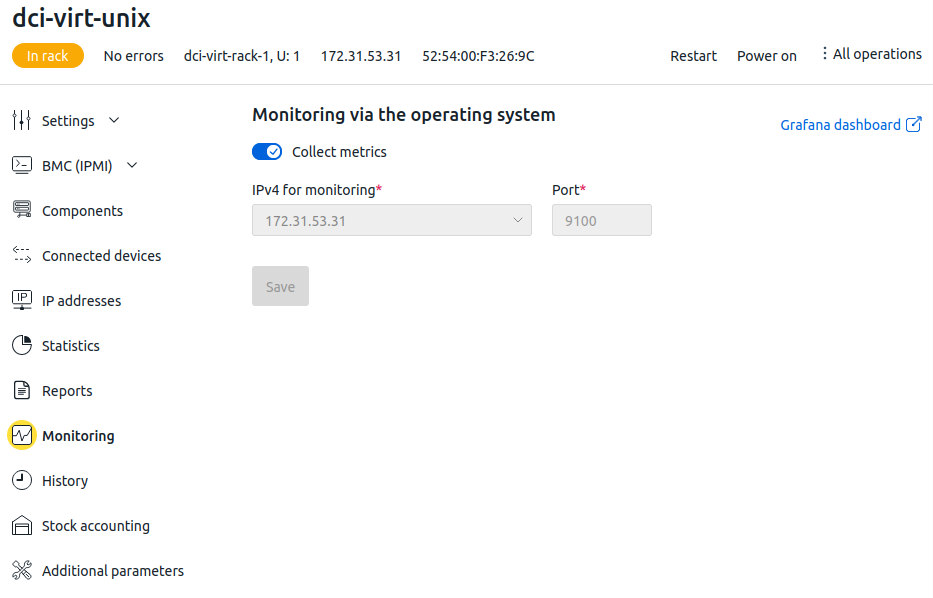
This section contains information about server connection settings: IPv4 address and port. Changing connection settings is not supported in the current version.
To disable monitoring on the server, disable the Collect metrics option → click Save.
To open the Grafana dashboard with server metrics, click the Grafana dashboard link. The link will open in a separate browser tab.
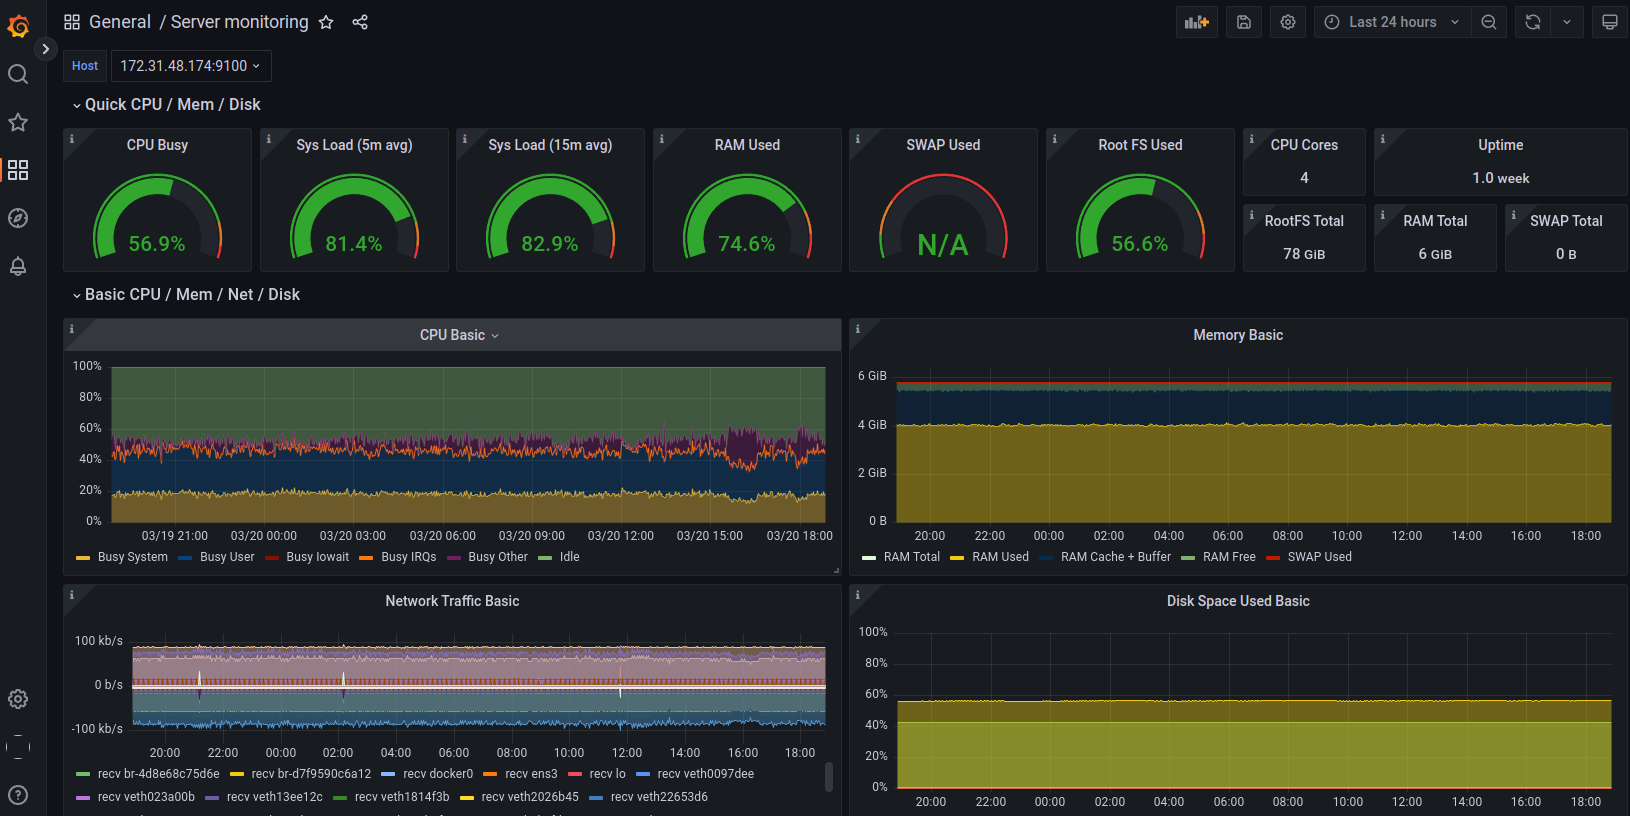
Example of Grafana dashboard
Diagnostics
To check the operation of the module, examine the logs:
- of the vmagent service:
- Connect to the location server via SSH.
Run the command:
docker logs vmagentBASH
- of the VictoriaMetrics software:
- Connect to the server with the platform via SSH.
Run the command:
journalctl CONTAINER_TAG=dci_victoria_metricsBASH