VM load statistics
Navigate to Statistics→ Cluster load.
Generate a report
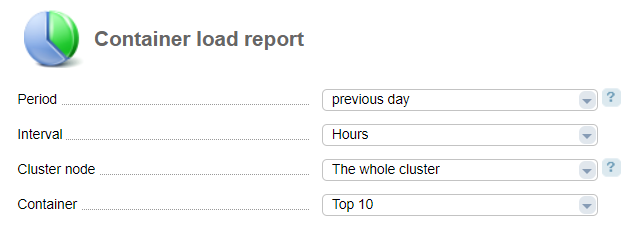
- Period — select a period:
- previous day;
- current day;
- current week;
- current month;
- current year;
- previous week;
- previous month;
- previous year;
- week;
- month;
- quarter;
- half-a-year;
- year;
- any period;
- whole period.
- Cluster nodes — select a cluster node to display the statistics.
- Virtual machine — select a virtual machine to display the statistics. Selecting "TOP 10" will show statistics for 10 virtual machines with the maximum load.
Statistics is collected for the following parameters
- outgoing traffic, GiB;
- incoming traffic, GiB;
- CPU, %;
- IOPS;
- RAM, %.
- average system load;
- RAM allocation problems ;
- CPU allocation problems;
- File problems;
- Open processes;
- Open files.
Note
Per-minute statistics is kept for 5 days. Per-hour statistics is kept for one month and 3 days. Per-day statistics is kept for 2 years. When the specified periods expire, the data will be deleted.
Graphs for a random period are generated based on a per-hour statistics.
How to generate a network traffic report
To generate the report, go to Management → Virtual machines → select the virtual machine → Bandwidth.
The report displays graphs for the following data:
- cost and threshold of incoming traffic over the day, Kbps;
- cost and threshold of outgoing traffic over the day, Kbps;
- speed of incoming traffic detailed by day, Kbps;
- speed of outgoing traffic detailed by day, Kbps.
Traffic threshold is average consumption of speed. To calculate this parameter, VMmanager:
- Calculates the average traffic speed each five minutes.
- Discards 5% peak values obtained. The maximum value of the remaining will be the traffic threshold.
How statistics is collected
Information about RAM, files, processes
Statistics is collected from the file /proc/bc/CTID/resources, where CTID is a container identifier.
RAM statistics is defined by beancounter physpages. The held field is the current RAM usage, limit is the total RAM, failcnt number of attempts when the system failed to allocated RAM. RAM usage is calculated as: held/limit*100.
File statistics is defined by beancounter numfile. The held field is the number of currently open files, failcnt number of attempts when the system failed to open a file.
Process statistics is defined by beancounter numproc. The held field is the number of currently open processes, failcnt — the number of attempts when the system failed to open a process.
I/O statistics
Statistics is collected from the file /proc/bc/CTID/iostat, where CTID is a container identifier.
The requests completed field is the number of completed input-output operations.