Cluster load
A cluster in VMmanager is a group of physical servers where virtual machines are running.
Navigate to Statistics→ Cluster load.
Generate a report
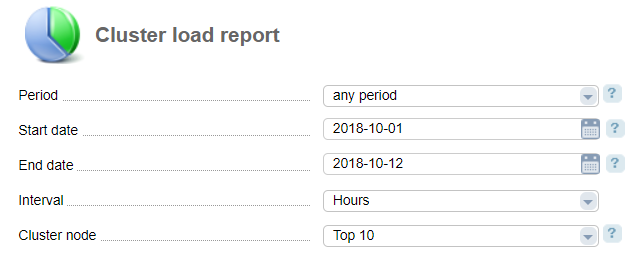
- Period — select a period:
- previous day;
- current day;
- current week;
- current month;
- current year;
- previous week
- previous month;
- previous year;
- week;
- month;
- quarter;
- half-a-year;
- year;
- any period;
- the whole period.
- Cluster nodes — select a cluster node to display the statistics.
Statistics is collected for the following parameters
- outgoing traffic, GiB;
- incoming traffic, GiB;
- CPU, %;
- IOPS;
- RAM, %.
- average system load;
Note
Per-minute statistics is kept for 5 days. Per-hour statistics is kept for one month and 3 days. Per-day statistics is kept for 2 years. When the specified periods expire, the data will be deleted.
Graphs for a random period are generated based on a per-hour statistics.
How statistics is collcted
Raw statistics is kept in the /usr/local/mgr5/var/stat/raw file and is updated every 5 minutes. Once an hour the control panel handles the raw statistics and delete it from the directory. The archive of the raw statistics is kept in /usr/local/mgr5/var/stat/mon/mainstat/.
Note
You can delete the archive of raw statistics only by means of the operating system.
Incoming and outgoing traffic
The information is taken from the /proc/net/dev file.Statistics files are copied to /var/stat/raw_bandwidth.
Receive Bytes — incoming traffic.
Transmit Bytes — outgoing traffic.
The main network interface of the cluster node is automatically selected as the interface.
Note
Network statistics are collected from physical and bonding interfaces. Statistics are not collected from virtual network interfaces.
CPU
The information is taken from the /proc/stat file.
The CPU usage is calculated as follows:
(user+nive+system) / (user+nice+system+idle) * 100user — percentage of CPU utilization that occurred while executing at the user level. nice — percentage of CPU utilization that occurred while executing at the user level with lower priority.
system —  percentage of CPU utilization that occurred while executing at the system level.
idle —  percentage of time that the CPU or CPUs were idle.
I/O operations
The information is collected from the /proc/diskstats file.
The usage is calculated as follows:
NumReads+NumWritesNumReads — field 1 of the file /proc/diskstats (Field 1 -- # of reads issued).
NumWrites — field 5 of the file /proc/diskstats (Field 5 -- # of writes completed).
The system calculates the data from all hard drives.
RAM
The information is collected from the /proc/meminfo function.
The usage is calculated as follows:
MemUsed / MemTotal * 100MemUsed = MemTotal - MemFree.
MemFree — free + cached.
MemTotal — the total field.
System load average
The information is taken from the /proc/loadavg file.
VMmanager analyses the average value for the last 5 minutes.