VMmanager collects statistics on resource usage on cluster nodes and virtual machines (VMs). These statistics are used to display graphs on the pages of VMs and nodes, on thedashboard and in Grafana.
Data is grouped by months and stored on the server with the platform in the /opt/ispsystem/vm/clickhouse directory. The storage period and parameters of statistics collection are set in the platform settings. At the beginning of each month, the platform deletes statistics data that has exceeded the storage period.
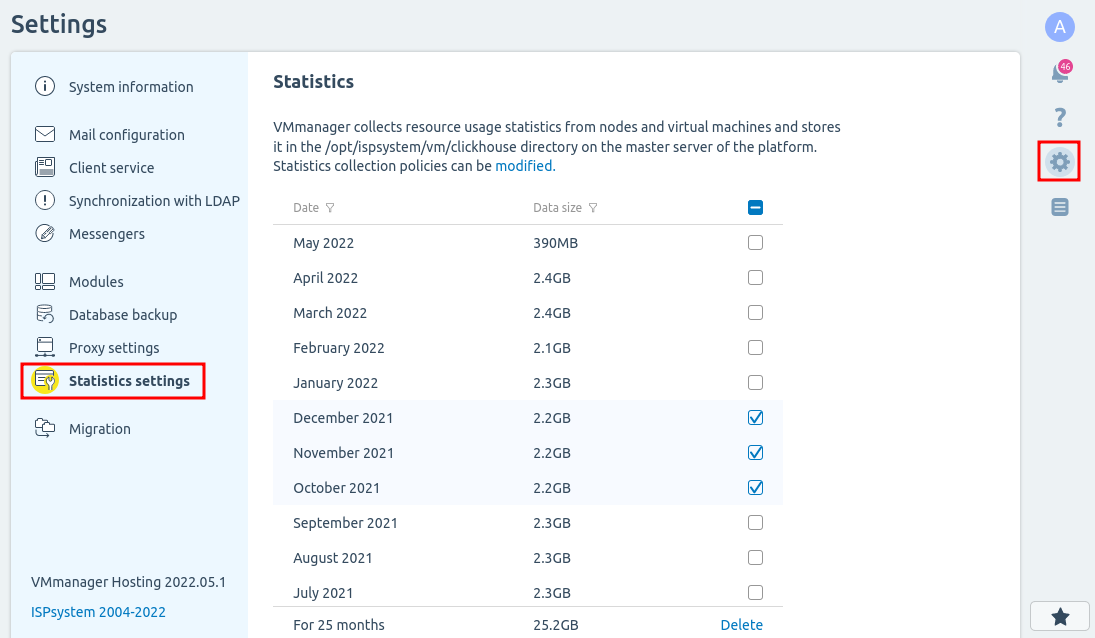
To manage statistics data, enter → Statistics settings.
Section interface
To delete statistics manually, select the periods in the list → Delete.
To edit statistics collection policies:
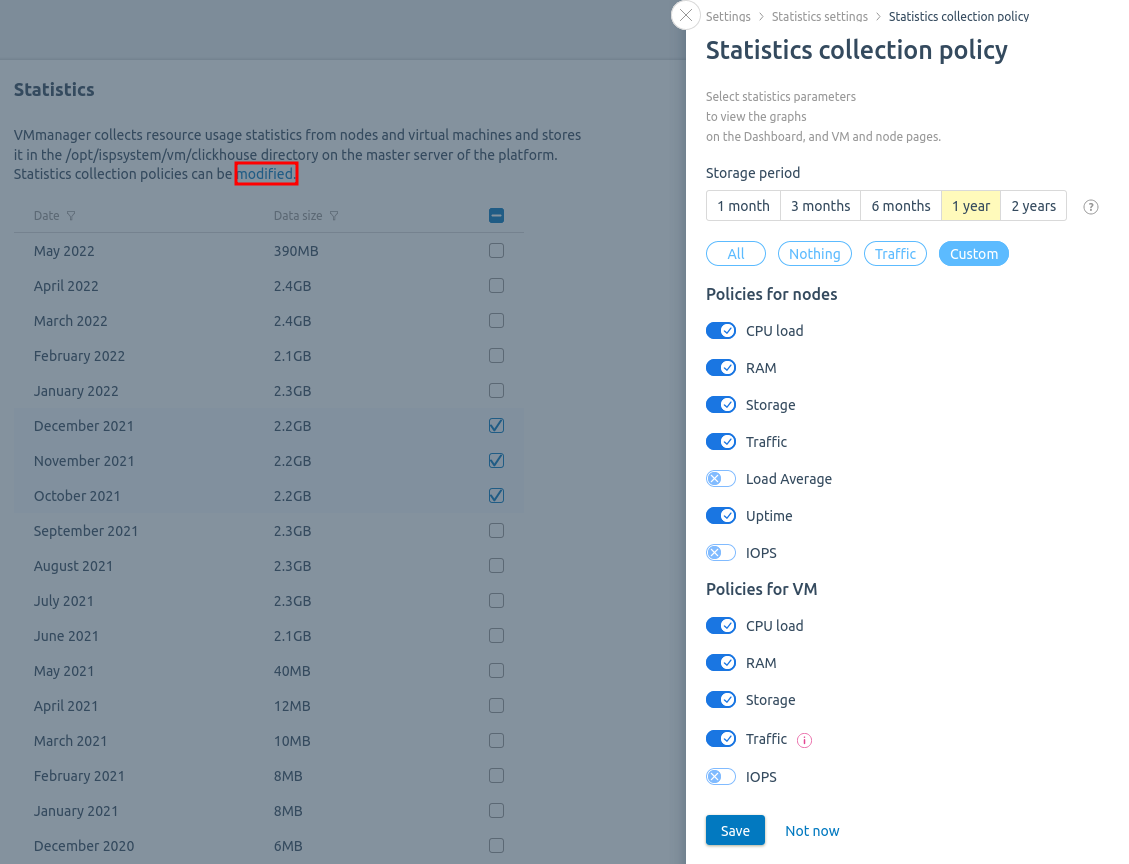
Press modified.
Select the Storage period:
1 month;
3 months;
6 months;
1 year;
2 years.
Select the parameters for which the statistics are to be stored:
for nodes:
CPU load;
RAM — free RAM size;
Storage — free disk space;
Traffic — inbound and outbound traffic values;
Load Average — average load value;
Uptime — time of uninterrupted operation of the node;
IOPS — number of input/output operations;
for VMs:
CPU load;
RAM — free RAM size;
Storage — free disk space;
Traffic — inbound and outbound traffic values;
Note
If you disable collection of traffic statistics for VMs, traffic in billing systems will not be counted.