To monitor the required metrics of cluster nodes and virtual machines, we recommend setting up your own dashboard in Grafana.

This article contains instructions on how to configure the dashboard for VMmanager platform. In the current version, the platform uses Grafana v6.7.4.

For instructions for the latest version of Grafana, see the official documentation.

Creating a dashboard


  1. Enter  CreateDashboard.
  2. Create a unique dashboard name: on the upper right menu, click the icon → enter the name in the Dashboard Name field Save button.

Configuring the panel


  1. To add a panel, on the upper right menu, click the  icon.
  2. In the panel widget, click the Add Query button.
  3. In the Query field, specify the data source — graphite_src.
  4. In the Series field, specify the metric name. Metric names for nodes have the format: 1.node.<node_id>.<node_metric>, metric names for virtual machines — 1.host.<vm_id_name>.<vm_metric>.

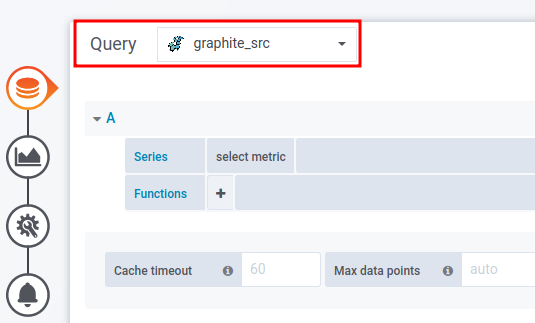
    <node_id> — cluster node id.

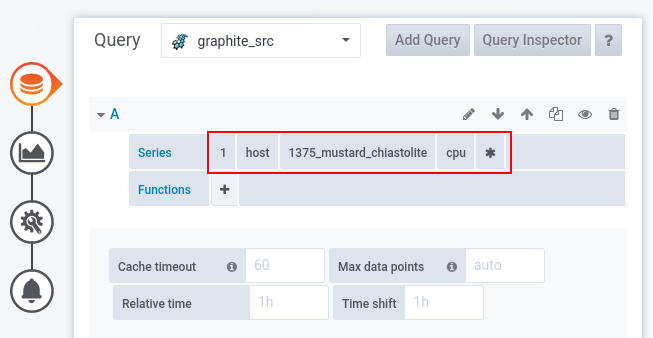
    <vm_name> — virtual machine id and name. E.g., 16_wizard_gold.

    <node_metric> — cluster node metric. Examples of values:

    • cpu — CPU load;
    • df.root.free — free space in the disk root section;
    • hdd.<device>.reads — disk section read IOPS. For example, hdd.sda1.reads;
    • hdd.<device>.writes — disk section write IOPS. For example, hdd.sdb1.writes;
    • la.mid — average node load;
    • mem — free RAM;
    • net.<interface>.rx — inbound traffic. For example, net.vmbr0.rx;
    • net.<interface>.tx — outbound traffic. For example, net.vmbr0.tx;
    • uptime — node uptime.

    <vm_metric> — virtual machine metric. Examples of values:

    • cpu.* — CPU load;
    • hdd — disk space used;
    • mem.unused — free RAM;
    • net.rx.bytes — inbound traffic;
    • net.tx.bytes — outbound traffic.
  5. Enter the  menu and select the data display method in the Visualization field.
  6. Enter the  menu and specify a discretionary metric name.
  7. To save settings, 
  8. On the upper right menu, click the icon → enter the settings commentSave button.