Dashboard
The VMmanager dashboard is a platform monitoring tool. The dashboard page consists of widgets with the current information about:
- clusters;
- cluster nodes;
- tasks;
- server with the platform.
To open the dashboard, click on the VMmanager logo in the upper left corner of the screen.
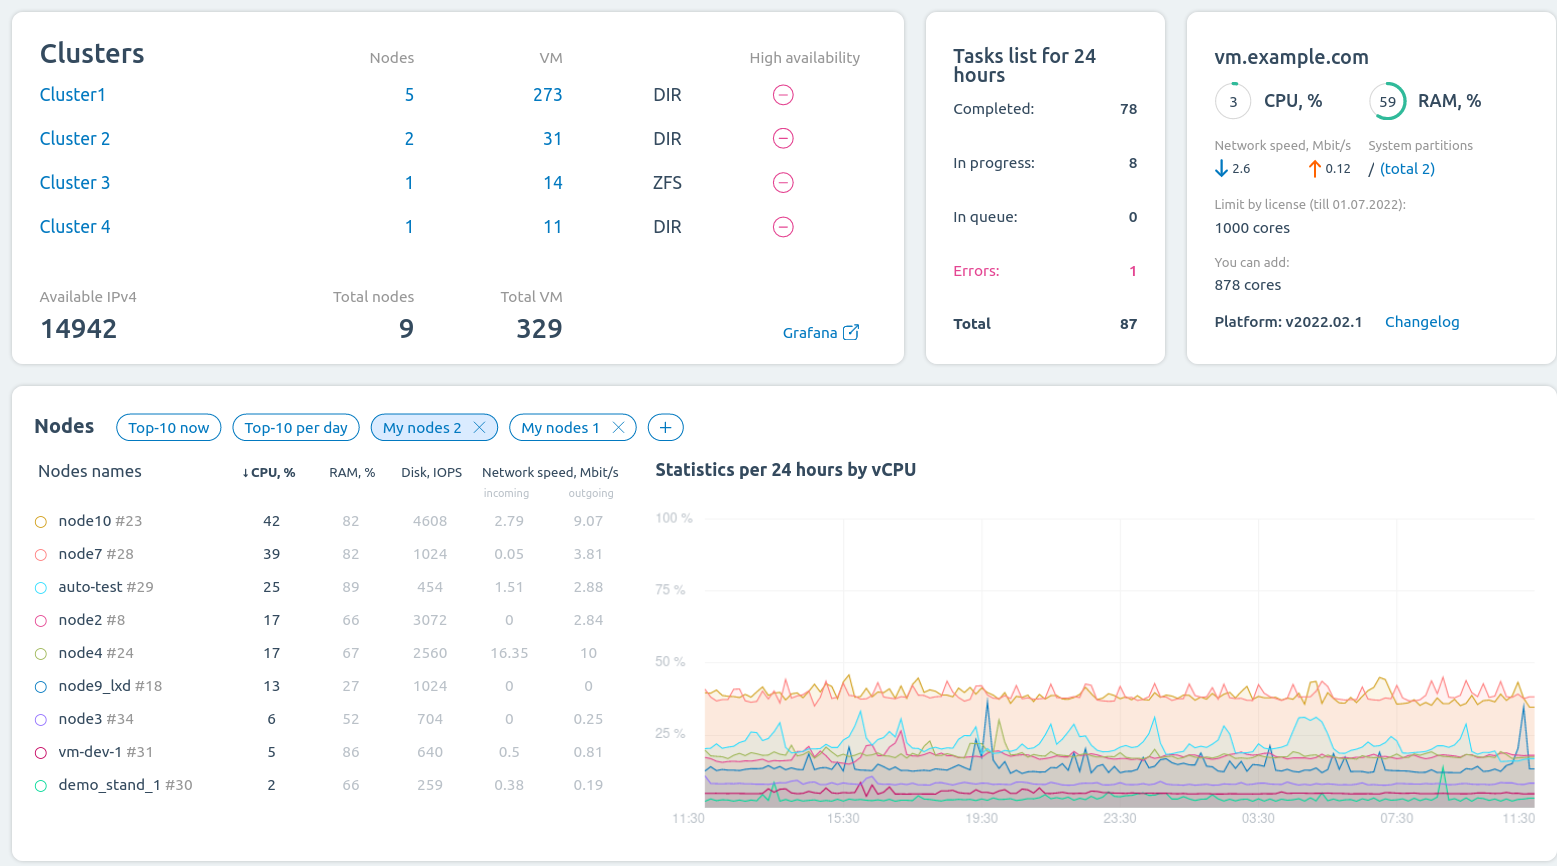
Dashboard interface
Clusters widget
This widget displays the status of clusters in the platform:
- number of nodes — clicking on the value will open the "Nodes" section with a filter by the selected cluster;
- number of virtual machines (VMs) — clicking on the value will open the "Virtual machines" section with a filter by the selected cluster;
- type of storage used;
- high availability status;
- number of free IP addresses.
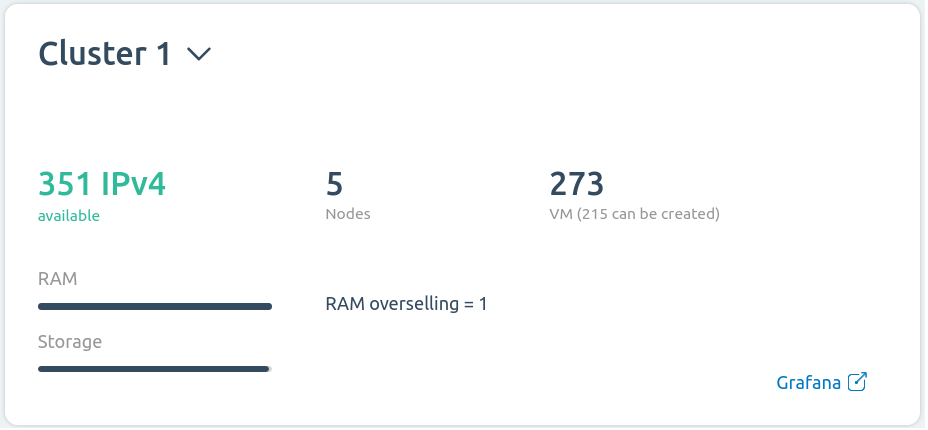
To get information about the status of a particular cluster, click on its name.
The Grafana link opens the web interface of the Grafana monitoring system.
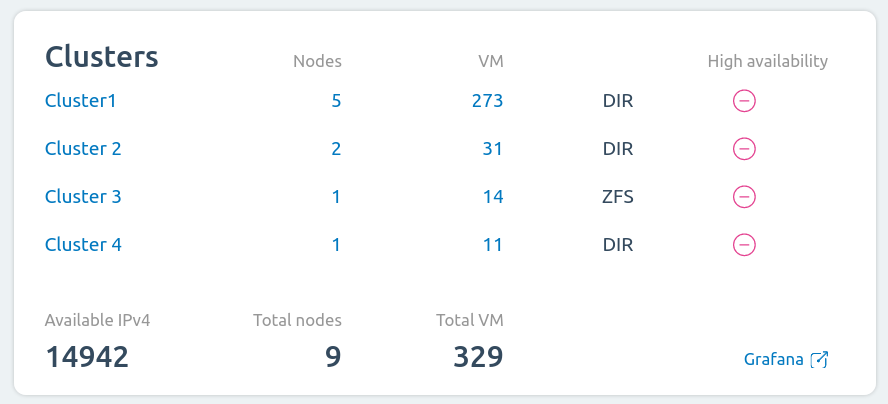
Widget interface
Tasks list for 24 hours widget
The widget contains information about the number of tasks of the platform for the last 24 hours:
- Completed — tasks completed with "Successfully" status;
- In progress — tasks currently running;
- In queue — tasks created;
- Errors — tasks ended with "Error" status;
- Total — total number of tasks.
Clicking on the task status will open the tasks list with the filter by the selected status.
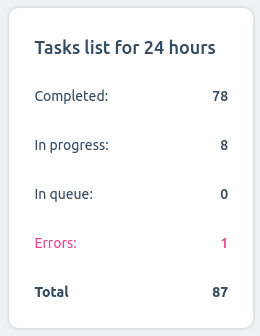
Widget interface
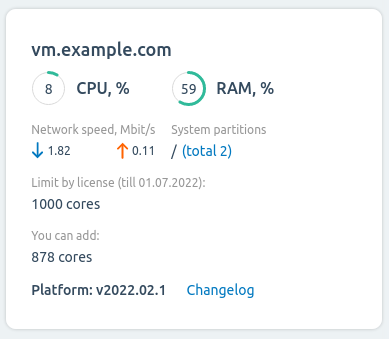
Platform server information widget
This widget displays:
- IP address or domain name of the server;
- CPU and RAM load;
- speed of incoming and outgoing traffic;
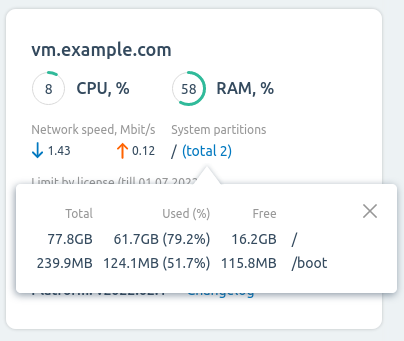
- system partitions — clicking on the value will open a list of partitions. If the partition is 80% or more full, the value is highlighted in red;
- license restrictions;
- platform version;
- link to the changelog.
Widget interface
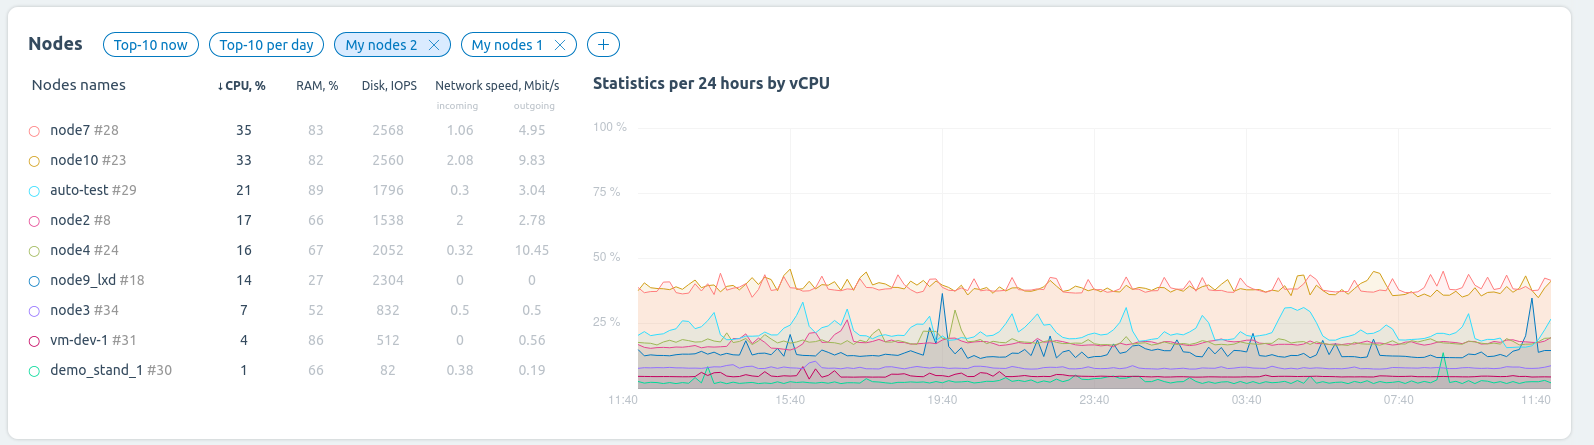
Nodes widget
This widget displays information about the nodes of all clusters. To view the information about the nodes of a particular cluster, select it in the "Clusters" widget.
To see the top 10 busiest nodes at the moment, press Top-10 now.
To see the top 10 busiest nodes in the last 24 hours, press Top-10 per day.
You can sort the list of nodes by a certain parameter. Click on the parameter name in the table header:
- CPU, % — CPU load;
- RAM, % — RAM use;
- Disk, IOPS — disk load;
- Network speed, Mbit/s — speed of incoming and outgoing traffic.
The right side of the widget displays a graph for the selected parameter.
To get information about the status of a particular node, click on its name. The information will be displayed on the right side of the widget.
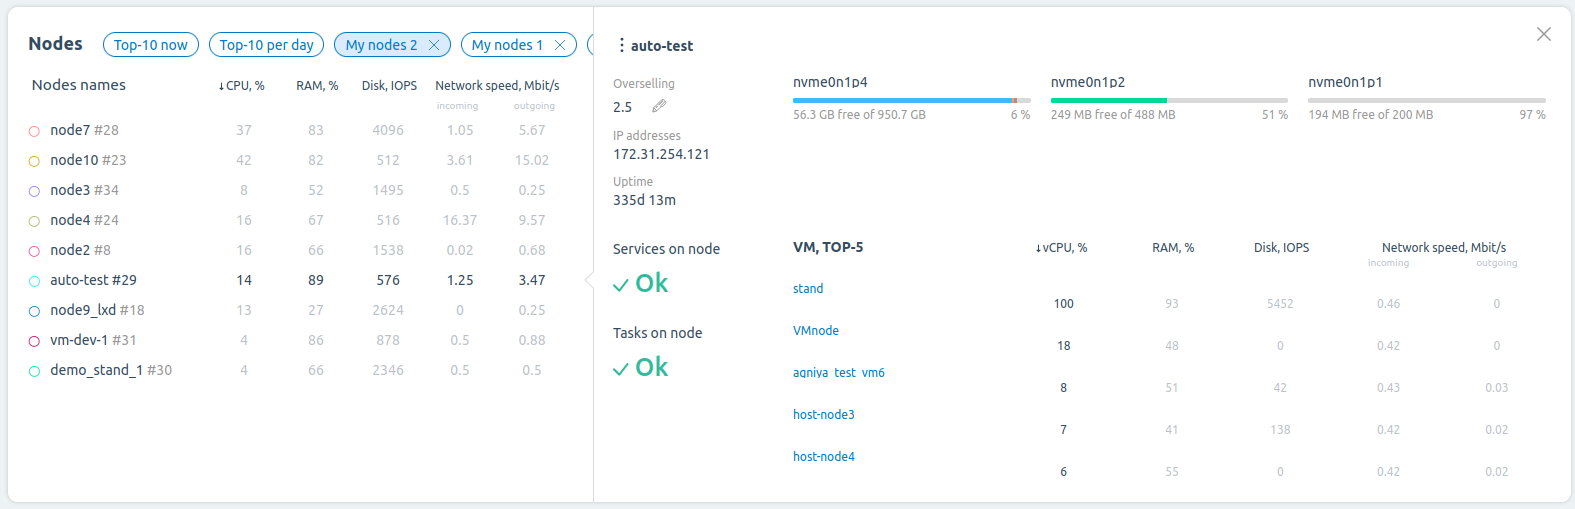
Widget interface
Node lists
You can create your own list of nodes to monitor. The list can contain from one to 10 nodes.
The list is saved for the account under which it was created. The list will not be available for other accounts.
To create a list:
- Press
 in the "Nodes" widget.
 - Enter the List name.
- Select the nodes to monitor.
- Press Select.
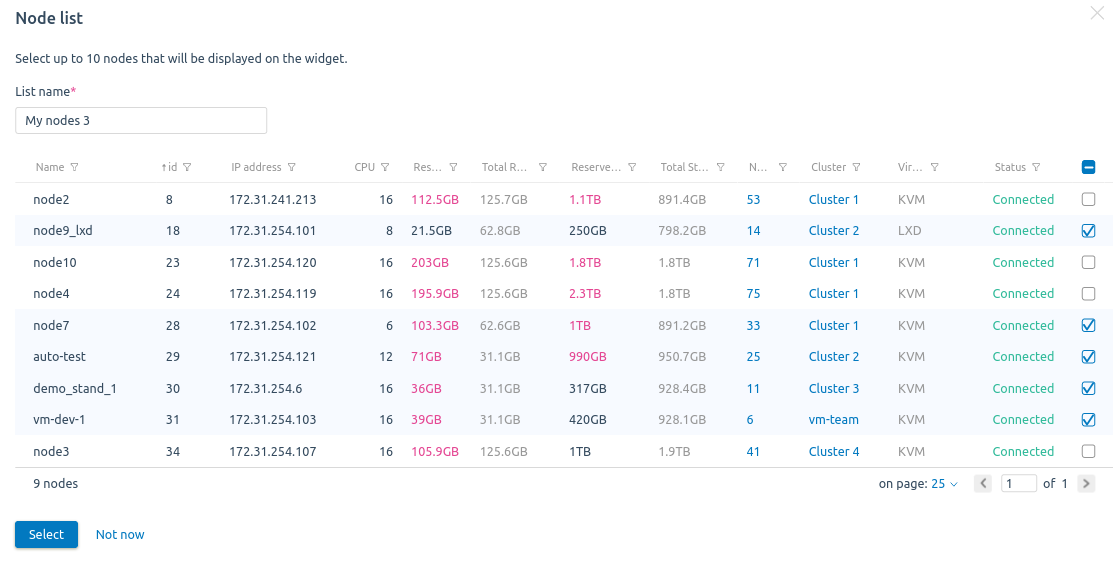
Creating a list
To display the nodes in the list, click on the list's name.
To delete a list, press ![]() next to its name.
next to its name.
User widgets
You can create up to five custom widgets. To add a widget, click the Add nodes link and select the nodes. VMmanager will create a widget with the specified list of nodes.
The widget is saved for the account under which it was created. The widget will not be available for other accounts.
To add a list of nodes to the widget, press Add one more list.
If you do not need the widget anymore, press Delete the widget.
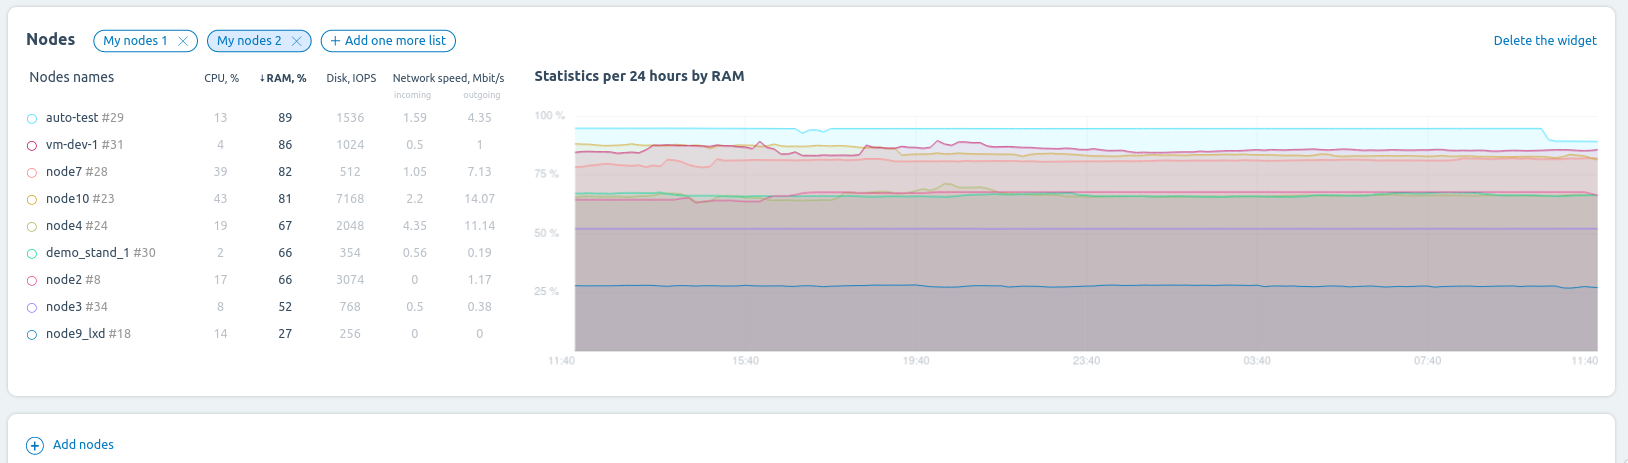
Widget example