Zabbix
Zabbix is an open source monitoring system. With Zabbix you can configure monitoring of virtual machines (VM) and other platform entities.
Main components of Zabbix:
- server — the component for managing network services, storing monitoring data, alerting the administrator about problems with equipment. You can use your own Zabbix server or create a VM to perform these functions;
- proxy — the intermediate service that collects data from VMs and sends it to the server. This component is optional. Proxy should be used to reduce the load on the server or if VMs do not have direct access to the server. You can create one or more VMs to act as proxy;
- agent — the software installed on the VM or cluster node. The agent collects monitoring data and transmits it to the server or proxy.
Read more about Zabbix in the official documentation.
Installing Zabbix components
Zabbix is installed on a VM using scripts from the ISPsystem repository. Versions 5.0 LTS, 6.0 LTS, and 6.4 are available for installation. The scripts can be run both when the VM is being created and after it has been created. Read more in Running scripts on the VM.
To install Zabbix on the cluster node, you will need to create an Ansible installation script. Read more in Creating a script for the node.
Server
The system requirements for the Zabbix server depend on the number of devices to be monitored. Read more about system requirements in the official Zabbix documentation.
To install a Zabbix server on a VM:
- version 5.0:
- Create a VM with CentOS 7, Ubuntu 20.04 or Debian 10.
- Run the Zabbix server script on the VM. Select 5.0 version.
- versions 6.0, 6.4:
- Create a VM with AlmaLinux 8, Ubuntu 22.04 or Debian 12.
- Run the Zabbix server script on the VM. Select the required version.
The web interface of the server will be available at the URL http://<IP of the created VM>:8080. For example, http://192.168.100.100:8080. To log in, use:
- username — Admin;
- password — zabbix.
Proxy
To install a Zabbix proxy on a VM:
- version 5.0:
- Create a VM with CentOS 7, Ubuntu 20.04 or Debian 10.
- Run the Zabbix proxy script on the VM. In the parameters, specify the IP address of the Zabbix server and select version 5.0.
- versions 6.0, 6.4:
- Create a VM with AlmaLinux 8, Ubuntu 22.04 or Debian 12.
- Run the Zabbix proxy script on the VM. In the parameters, specify the IP address of the Zabbix server and select the required version.
Agent
To install a Zabbix agents on a VM:
- Run the following on the VM:
- with Linux family OS — Zabbix agent2 linux script;
- with Windows OS — Zabbix agent2 windows script.
- Specify in the ZABBIX_SERVER parameter:
- if you are using a proxy — the IP address of the Zabbix proxy;
- if you are not using a proxy — the IP address of the Zabbix server.
- Select Zabbix server version.
To install a Zabbix agents on cluster nodes:
- Enter Scripts → For nodes → Create script.
Create an Ansible script and specify the Zabbix server IP instead of the <zabbix_server> fragment in the Change Server IP and Change Active Server IP sections:
Script content--- - name: Install zabbix-agent playbook hosts: all debugger: on_failed tasks: - name: Install zabbix-release AlmaLinux 8 yum: name: https://repo.zabbix.com/zabbix/6.0/rhel/8/x86_64/zabbix-release-6.0-4.el8.noarch.rpm state: present disable_gpg_check: yes validate_certs: no when: ansible_os_family == "RedHat" and ansible_distribution_major_version == "8" - name: Install zabbix-release CentOS 7 yum: name: https://repo.zabbix.com/zabbix/6.0/rhel/7/x86_64/zabbix-release-6.0-4.el7.noarch.rpm state: present when: ansible_os_family == "RedHat" and ansible_distribution_major_version == "7" - name: Install zabbix release package apt: deb: https://repo.zabbix.com/zabbix/6.0/ubuntu/pool/main/z/zabbix-release/zabbix-release_6.0-1+focal_all.deb when: ansible_distribution == 'Ubuntu' - name: Install zabbix-agent2 package package: name: zabbix-agent2 state: present - name: Change Server IP lineinfile: path: /etc/zabbix/zabbix_agent2.conf regexp: 'Server=127.0.0.1' line: "Server=127.0.0.1,<zabbix_server>" - name: Change Active Server IP lineinfile: path: /etc/zabbix/zabbix_agent2.conf regexp: 'ServerActive=127.0.0.1' line: "ServerActive=127.0.0.1,<zabbix_server>" - name: Stop zabbix-agent service: name: zabbix-agent state: stopped enabled: no ignore_errors: yes - name: Start zabbix-agent2 service: name: zabbix-agent2 state: started enabled: yes - name: Create a new sudoers file file: path: /etc/sudoers.d/zabbix state: touch mode: 0400 owner: root - name: Add sudoers copy: dest: /etc/sudoers.d/zabbix content: | Defaults:zabbix !requiretty Cmnd_Alias ZABBIX_CMD = /usr/bin/virsh -q list, /usr/bin/virsh -q list --all zabbix ALL = (root) NOPASSWD: ZABBIX_CMD - name: Add vmmanager config to zabbix file: path: /etc/zabbix/zabbix_agent2.d/vmmanager.conf state: touch mode: 0644 owner: root - name: Configure zabbix for VMmanager copy: dest: /etc/zabbix/zabbix_agent2.d/vmmanager.conf content: | UserParameter=vm.all,sudo virsh -q list --all | wc -l UserParameter=vm.running,sudo virsh -q list | wc -lYML- Run the script on cluster nodes.
Zabbix server configuration
To configure the Zabbix server, specify proxy configurations and add a VM for monitoring.
Adding proxy configuration
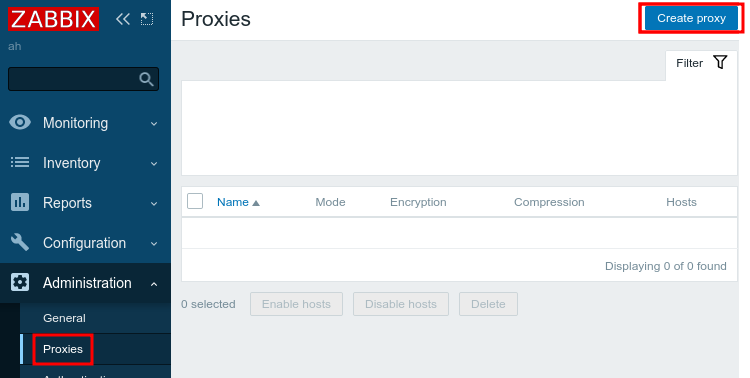
- Enter Administration → Proxies → Create proxy.
- Specify proxy settings:
- Proxy name — discretionary proxy name.
- Proxy mode — proxy’s operating mode. Select Passive.
- IP address — proxy's IP address.
- DNS name — DNS server name. Leave the default value — localhost.
- Connect to — connection type. Select IP.
- Port — connection port. Leave the default value — 10051.
- Description — discretionary proxy description.
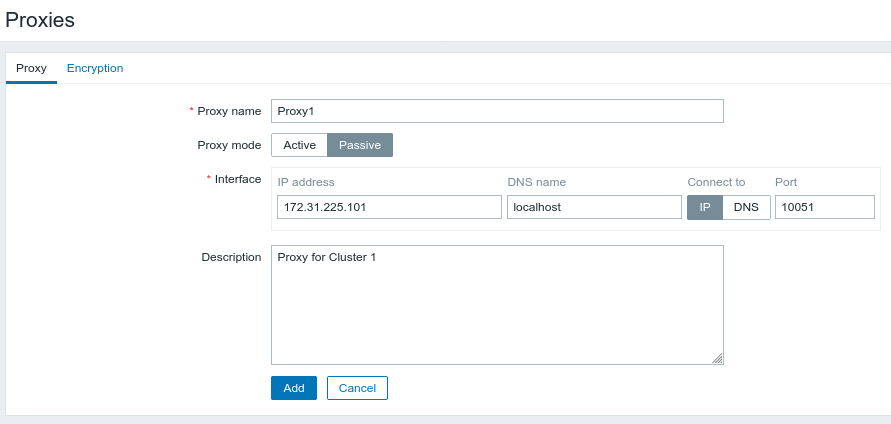
- Click Add.
Adding platform monitoring
Create a token for authorization in the platform:
curl -k -X POST -H "accept: application/json" -H "Content-Type: application/json" 'https://domain.com/auth/v4/public/token' -d '{"email": "admin_email", "password": "admin_pass"}'CODEComments to the commanddomain.com — domain name or IP address of the server with the platform
admin_email — platform administrator's email
admin_pass — platform administrator's password
In response, you will get the message in the form:
Example of response in JSON
{ "confirmed": true, "expires_at": null, "id": "6", "token": "4-e9726dd9-61d9-2940-add3-914851d2cb8a" }CODESave the received token value.
Create a token with extended lifetime:
curl -k -X POST -d '{"description": "Integration with Zabbix", "expires_at": "<expire_time>"}' -H "accept: application/json" -H "Content-Type: application/json" -H "x-xsrf-token: <token>" "https://domain.com/auth/v4/token"BASHComments to the command<expire_time> — expiration time in the format YYYYY-MM-DD HH:MM:SS. For example, 2025-01-01 00:00:00:00
<token> — authorization token
domain.com — domain name or IP address of the server with the platform
In response, you will get the message in the form:
Example of response in JSON
{ "confirmed": true, "expires_at":"2025-01-01 00:00:00", "id": "7346", "token": "14626-897fd91a-5787-4874-8b26" }CODESave the received token value — authorization token with extended lifetime.
- Download templates from the Zabbix repository:
- for Zabbix 5.4:
- template_vmmanager_6_master.yaml — for platform monitoring.
- template_vmmanager_6_kvm_hypervisor.yaml — for cluster nodes monitoring.
- for Zabbix 6.0:
- template_vmmanager_6_master.yaml — for platform monitoring.
- template_vmmanager_6_kvm_hypervisor.yaml — for cluster nodes monitoring.
- for Zabbix 5.4:
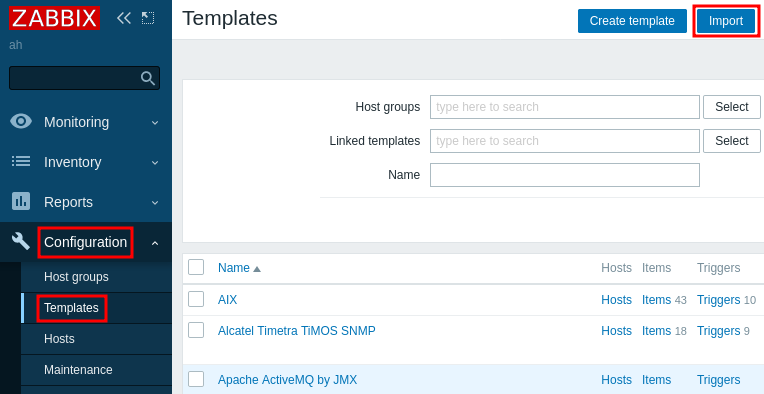
- Import the downloaded templates into Zabbix: Configuration → Templates → Import → select the template file → Import → Import.
- Enable server monitoring with VMmanager in Zabbix:
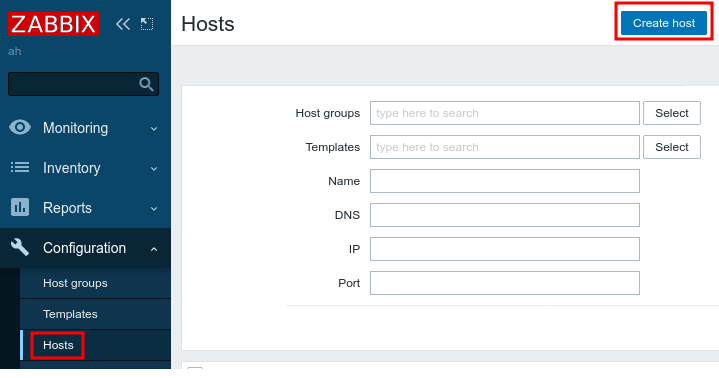
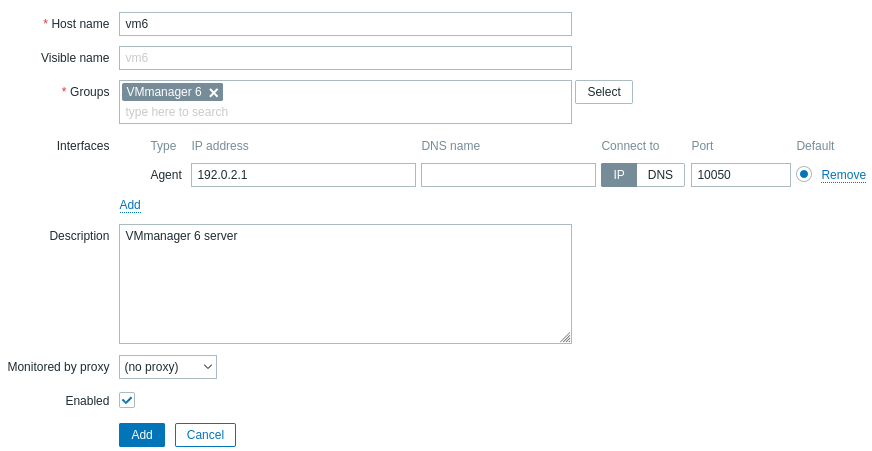
- Enter Configuration → Hosts → Create host.
- Specify the server parameters:
- Host name — discretionary name for designation of the server in the Zabbix database.
- Visible name — discretionary name for display of the server in the Zabbix database.
- Groups — group of objects. Select VMmanager 6.
- Interfaces — network interfaces. Click Add → Agent.
- IP address — IP address of the server with the platform.
- DNS name — DNS server name. Leave the default value empty.
- Connect to — connection type. Select IP.
- Port — connection port. Leave the default value — 10050.
- Description — discretionary VM description.
- Monitored by proxy — proxy used. Select the name of the proxy, if you are using one.
- Enabled — enable this option to activate the monitoring of this VM.
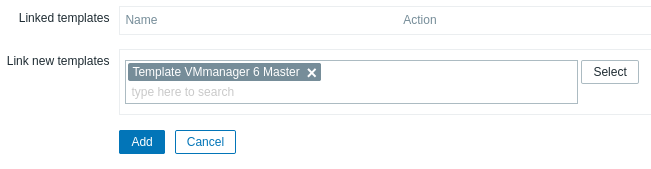
- Go to the Templates tab and enter the following in the Link new templates field: Template VMmanager 6 Master.
- Go to the Macros tab and add macros:
- {$VM6_TOKEN} — authorization token with extended lifetime.
- {$VM6_URL} — URL of the server with the platform in the format https://vm6.example.com/vm/v4, where vm6.example.com is the domain name or the IP address of the server with the platform.
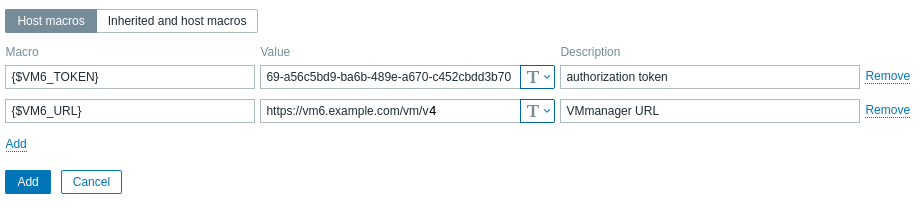
- Click Add.
- Enter Configuration → Hosts → Create host.
- Enable cluster node monitoring in Zabbix:
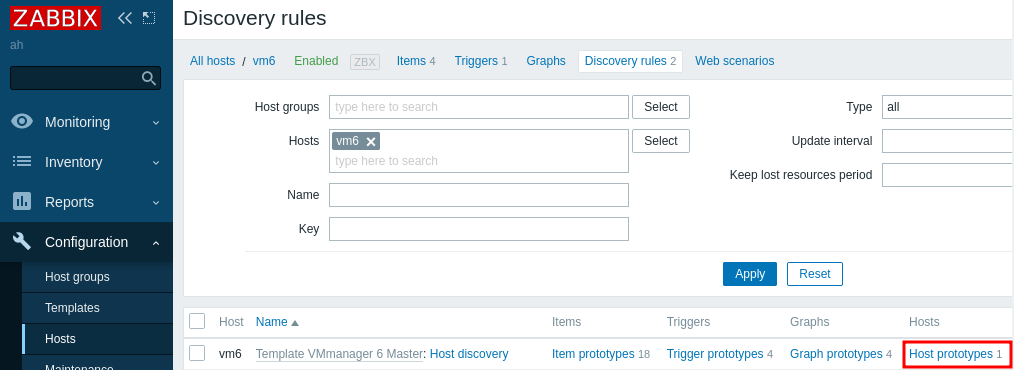
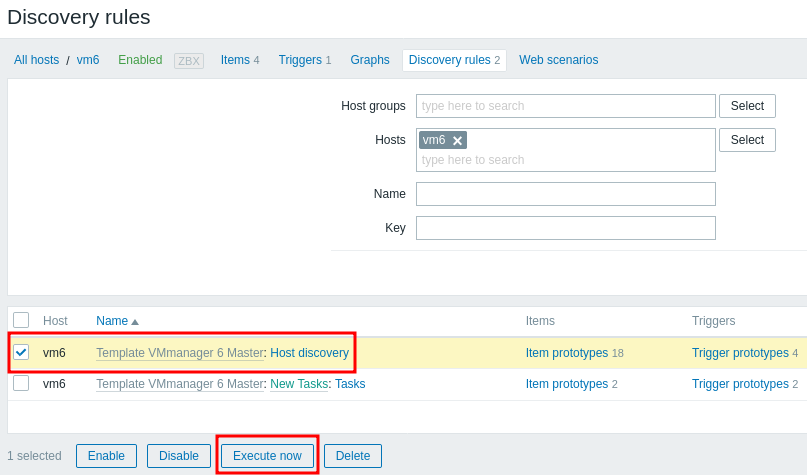
- Enter Configuration → Hosts → select the server with the platform → Discovery.
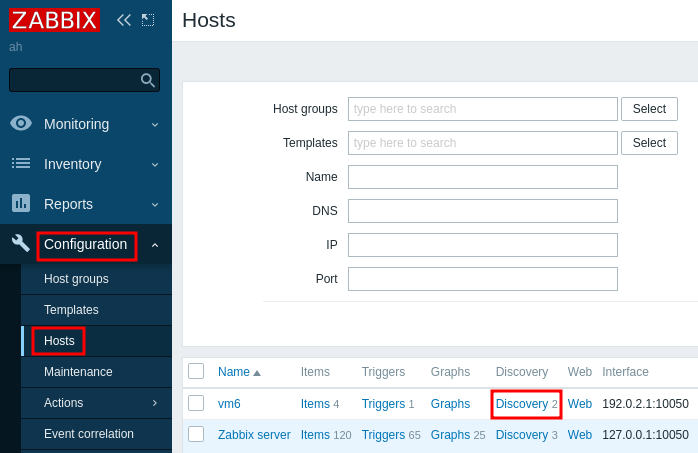
Under Discovery Rules in the Template VMmanager 6 Master: Host discovery line, click Host prototypes.
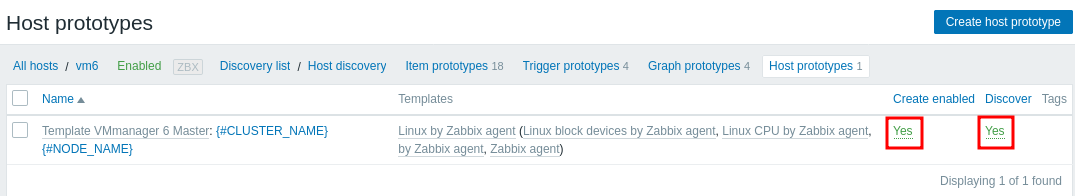
- In the Host Prototypes section, enable the Create enabled and Discover options for the server.
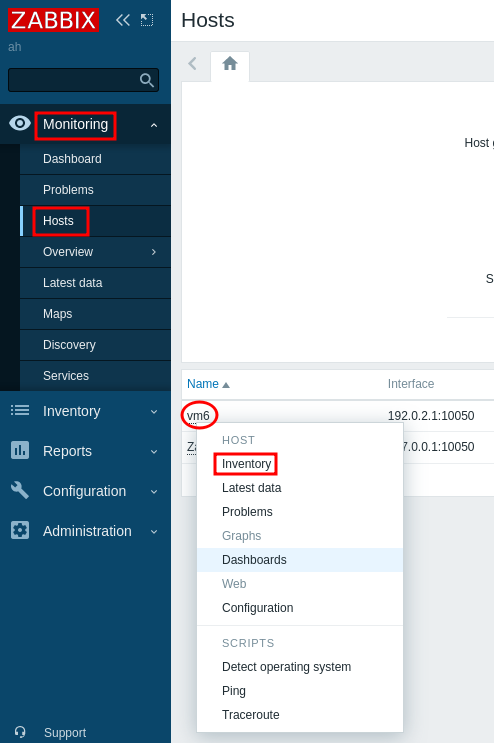
- Enter Monitoring → Hosts → select the server with the platform → Inventory.
- In the Host Inventory section, click Discovery.
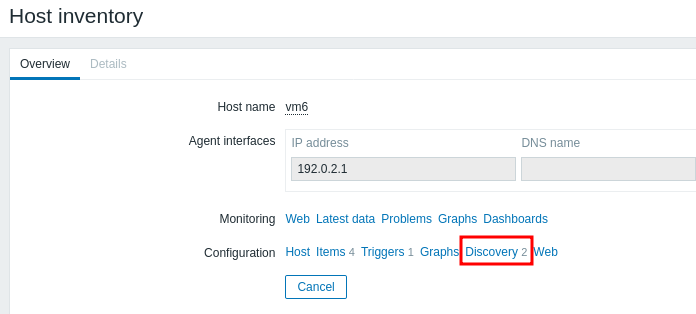
- Select the line VMmanager 6 Master: Host discovery → Execute now.
- Enter Configuration → Hosts → select the server with the platform → Discovery.
Zabbix will connect to VMmanager and get a list of cluster nodes to monitor. To have new cluster nodes automatically added to the Zabbix settings, install the Zabbix agent on the nodes.
Adding a certain VM for monitoring
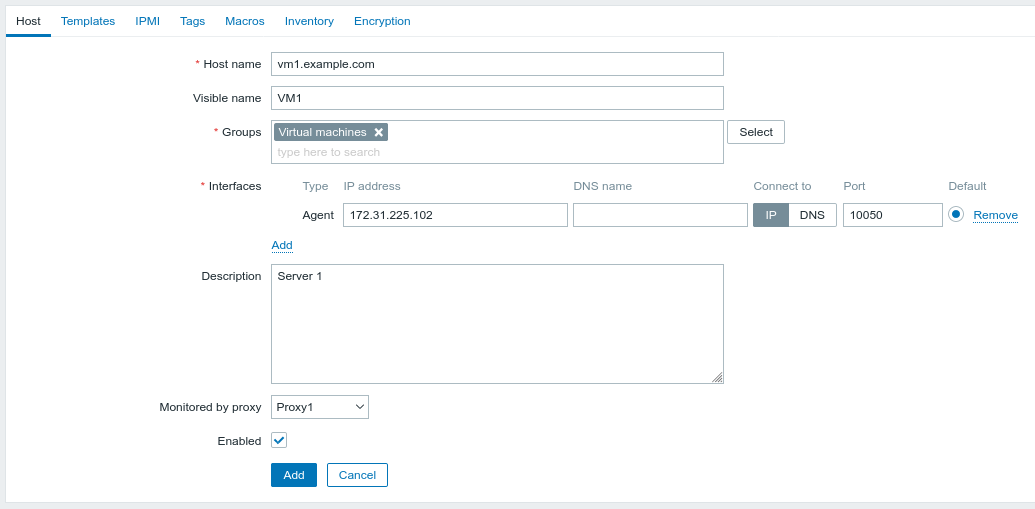
- Enter Configuration → Hosts → Create host.
- Add the VM settings:
- Host name — discretionary name for designation of the VM in the Zabbix database.
- Visible name — discretionary name for display of the VM in the Zabbix database.
- Groups — group of objects. Select Virtual machines.
- Interfaces — network interfaces. Click Add → Agent.
- IP address — VM's IP address.
- DNS name — DNS server name. Leave the default value empty.
- Connect to — connection type. Select IP.
- Port — connection port. Leave the default value — 10050.
- Description — discretionary VM description.
- Monitored by proxy — proxy used. Select the name of the proxy, if you are using one.
- Enabled — enable this option to activate the monitoring of this VM.
- Go to the Templates tab and select the template for VM monitoring in the Link new templates field:
- with Linux family OS - Template OS Linux by Zabbix agent;
- with Windows OS - Template OS Windows by Zabbix agent.
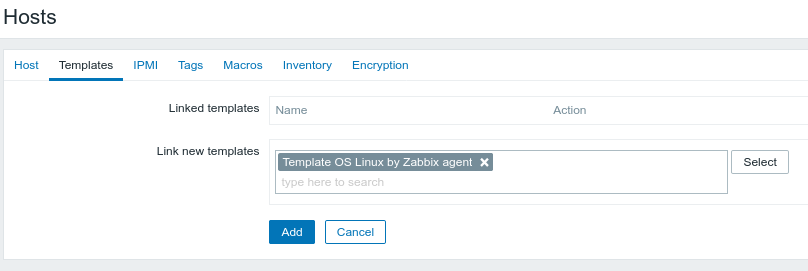
- Click Add.
Useful tips
Related topics: