DCImanager 6 collects statistics on traffic for servers. Data for statistics are collected every five minutes from the switch ports to which the server is connected.
Data are collected by the following parameters:
- traffic volume — total amount of transmitted information. Both incoming and outgoing traffic is taken into account;
- channel load — volume of data transmitted over the communication channel per unit of time. Both incoming and outgoing traffic is taken into account;
- channel load (Burstable) — the actual bandwidth consumption based on the burstable methodology: 5% of the maximum measurements collected with an interval of 5 minutes for the selected period are not taken into account. Both incoming and outgoing traffic is taken into account.
The statistics data are stored for one year.
DCImanager 6 user has access to statistics only for the servers he or she owns.
To view the server statistics, go to the server page: Servers → select the server → menu → Server parameters → Statistics. You can view statistics over the day, week, month, year or choose an arbitrary period. You can also view statistics for a specific server network interface.
To view the parameter value at a specific time moment, move the cursor over the graph. To scale the graph on the time axis, select the required time interval on the graph or select it with the buttons above the graph.
The total parameter value over the selected period is displayed under the graph.
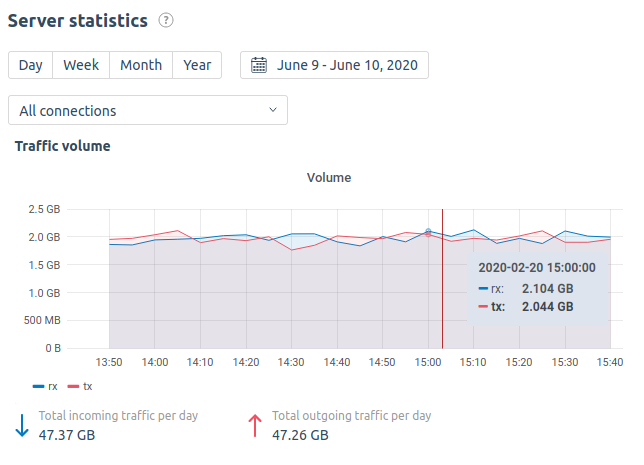
Statistics section interface