Description of the BI system module
BI system (Business Intelligence) is a set of tools and technologies for collecting, analyzing, visualizing and processing business data.
For business owners, the BI module will help in obtaining information about the state of the business, which is based on key metrics - revenue, profits, active clients and costs.
For data analysts, the BI module provides the ability to perform summary data analysis, build charts and graphs to identify trends, patterns and important correlations.
The BI module automates the following processes:
- data extraction from various sources;
- transforming the data into a suitable form for analysis;
- visualization in the form of reports, graphs and charts.
Order a free license for the module: log in to your client area → go to Products → Modules → select BI (Beta) module → click Order.
The module can be installed from the BILLmanager interface. You can install the BI module on the same server as BILLmanager or on a separate one. You can use the module right after installing it, because it contains a set of customized reports and graphs, which are built using data from BILLmanager. The module provides the ability to connect your own sources and data sets, and make your own graphs and reports.
Module components
The BI module uses the following components to work:
- ETL (Extract, Transform, Load) - a component that collects and converts data for further transfer to the storage. Developed by ISPsystem.
The BILLmanager database is used as the main source. ETL is configured by default to export certain data sets. You can also connect other databases, web services, etc.
ETL is responsible for: - importing and exporting data from connected sources;
- merging tables;
- performing data denormalization;
- additional transformations and transfer of the result to the analytical data storage.
- Analytical data storage (OLAP — online analytical processing). For data storage, the Clickhouse column DBMS is used, which is capable of providing high performance when processing large amounts of data. It can be used both on virtual servers with a relatively small amount of RAM and in a cluster, all depending on the amount of data.
- Data visualization. The Apache Superset 2.1.0 service is used for data visualization (building and viewing reports and graphs, combining them into dashboards). This software is open source.
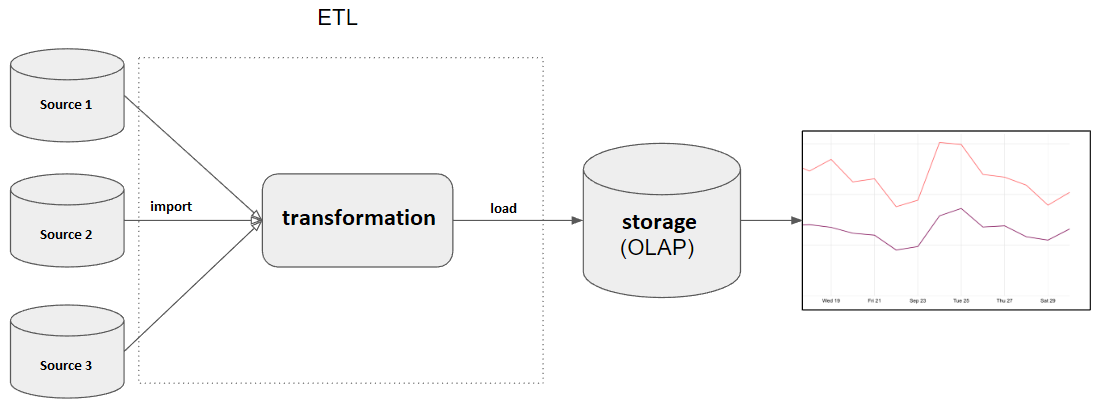
Component interconnection diagram